Usage and Estimated Costs
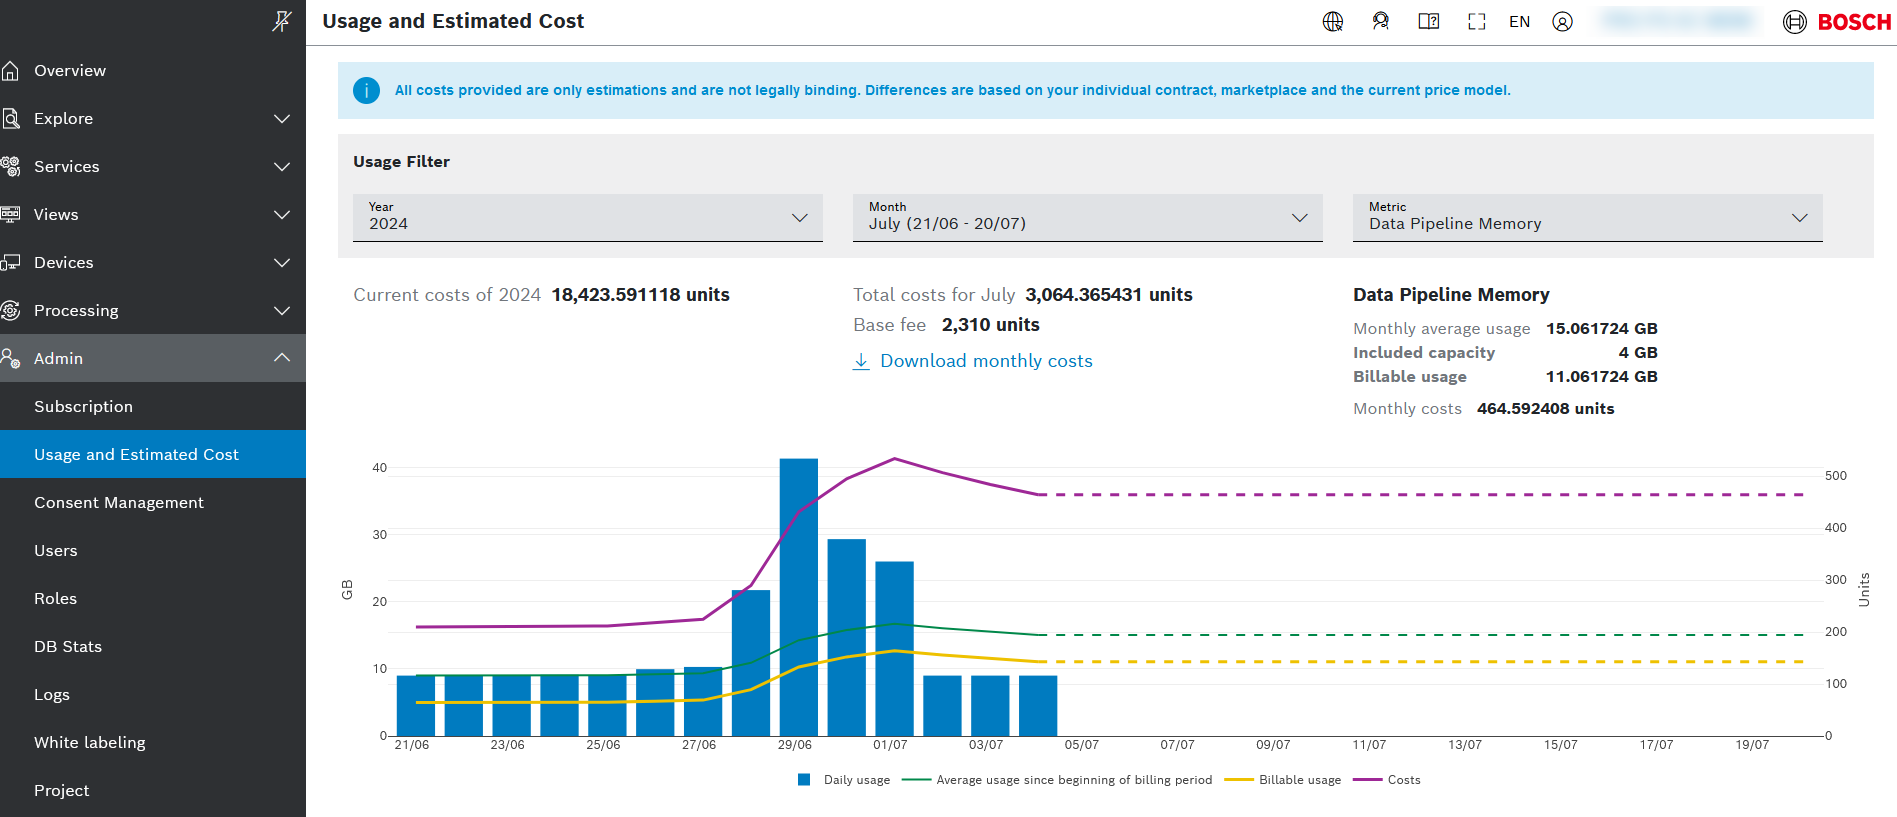
In Usage and Estimated Costs, an overview of the usage and estimated costs for relevant metrics is provided on a monthly base.
Please note that the period of a billing month differs from a calendar month: 21st of previous month to 20th of selected month.
The data is calculated every day based on the measurements gathered during the previous day. This is why there is only data available up to the previous day.
The Usage and Estimated Costs view is only visible for admins or owners.
Prerequisites
You are assigned to the project Admin role, then you can see the usage information.
You are assigned to the project Owner role, then you can also see the unit costs.
Proceed as follows
Click the Admin menu item to unfold it.
Click the Usage and Estimated Costs sub-item.
→ The view displays the information of your project usage and the estimated costs per selected Year, Month and Metric.Change the Usage Filter according to your needs.

The green line shows the aggregated usage for the selected metric based on its daily usage. Depending on the metric,
the aggregated usage is calculated as average or as sum from the start of the billing period to each day.The yellow line shows how much of this usage is not yet included in your plan and thus affects billing.
The purple line shows the estimated costs.
General functions
Filtering usage
In the Usage Filter pane, select the filter criteria Year, Month and Metric. The values and the chart will be updated accordingly.

Saving and sharing filtering
When modifying the filters, the URL in the browser is changed automatically according to your selection.
Thus, you might share a specific view or store a bookmark according to your needs.
Displaying details
When hovering over the diagram, you can display the details of the hovered day.

Downloading Estimated Costs
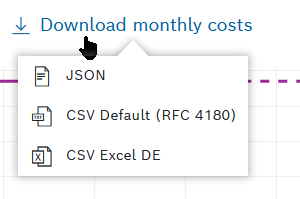
When clicking on the download icon you can select from a list of formats. The downloaded file will list the total estimated costs as well as individual costs for each metric.
