November
November 29, 2023: New layout
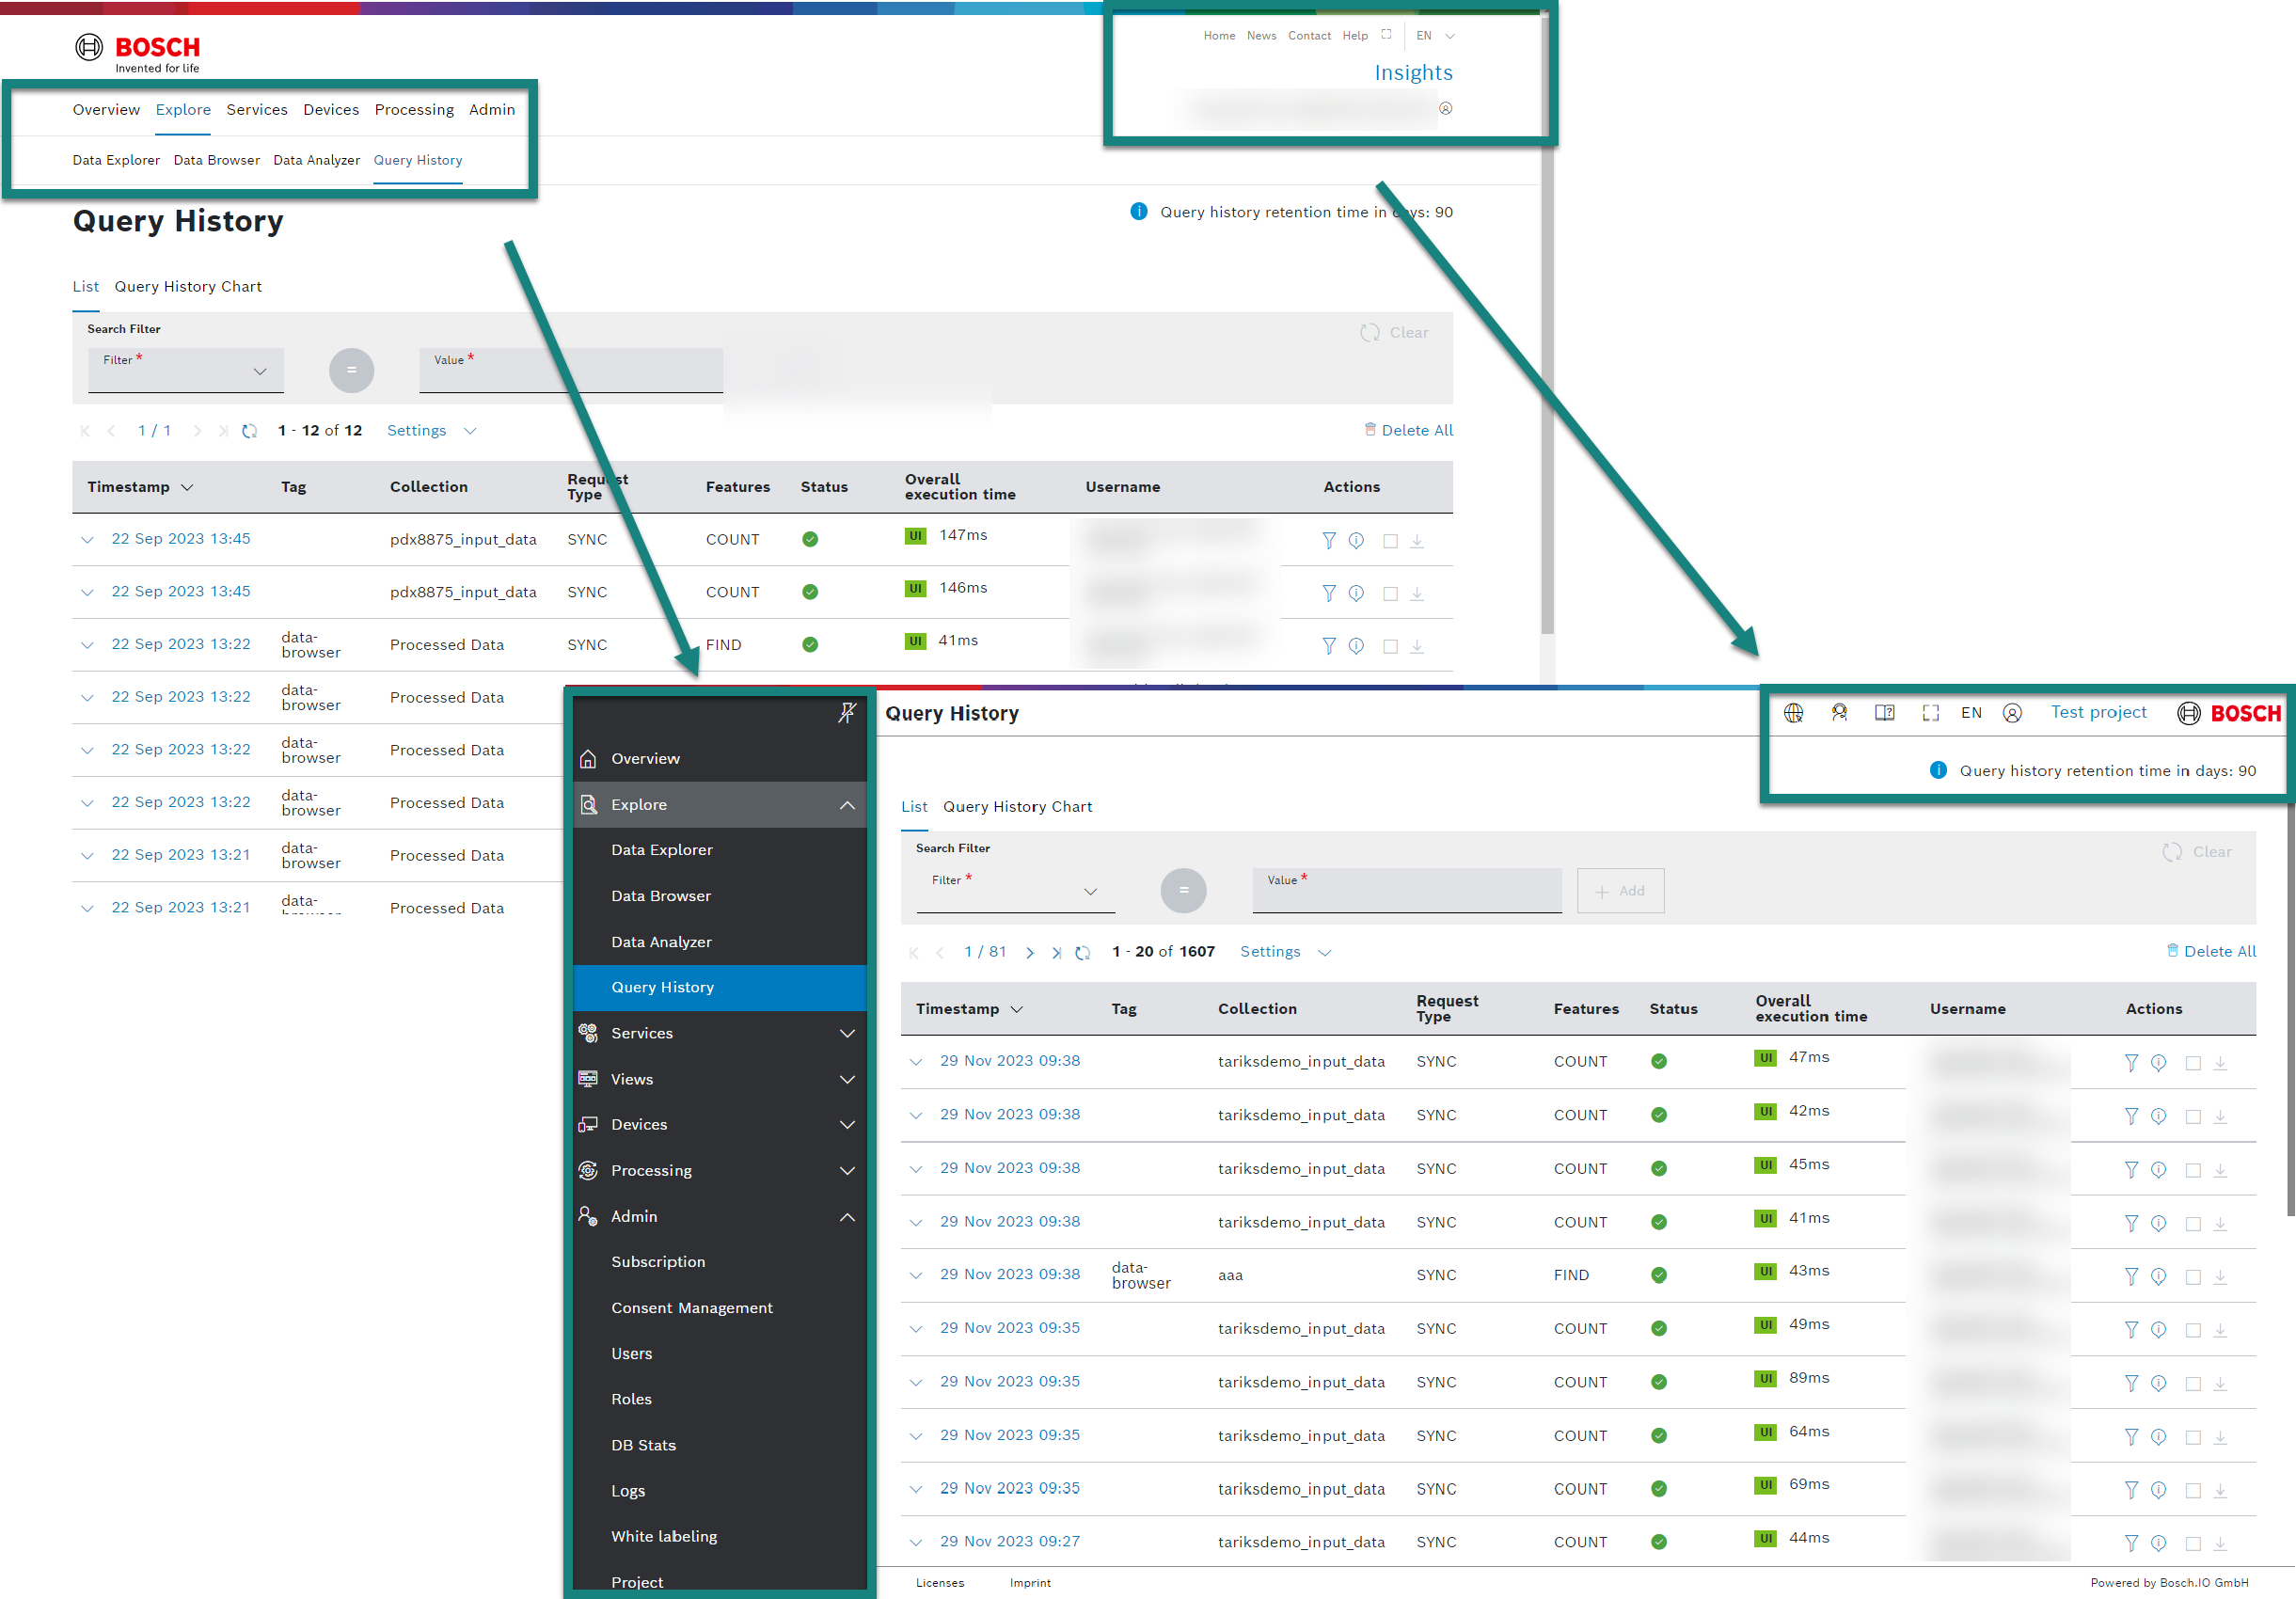
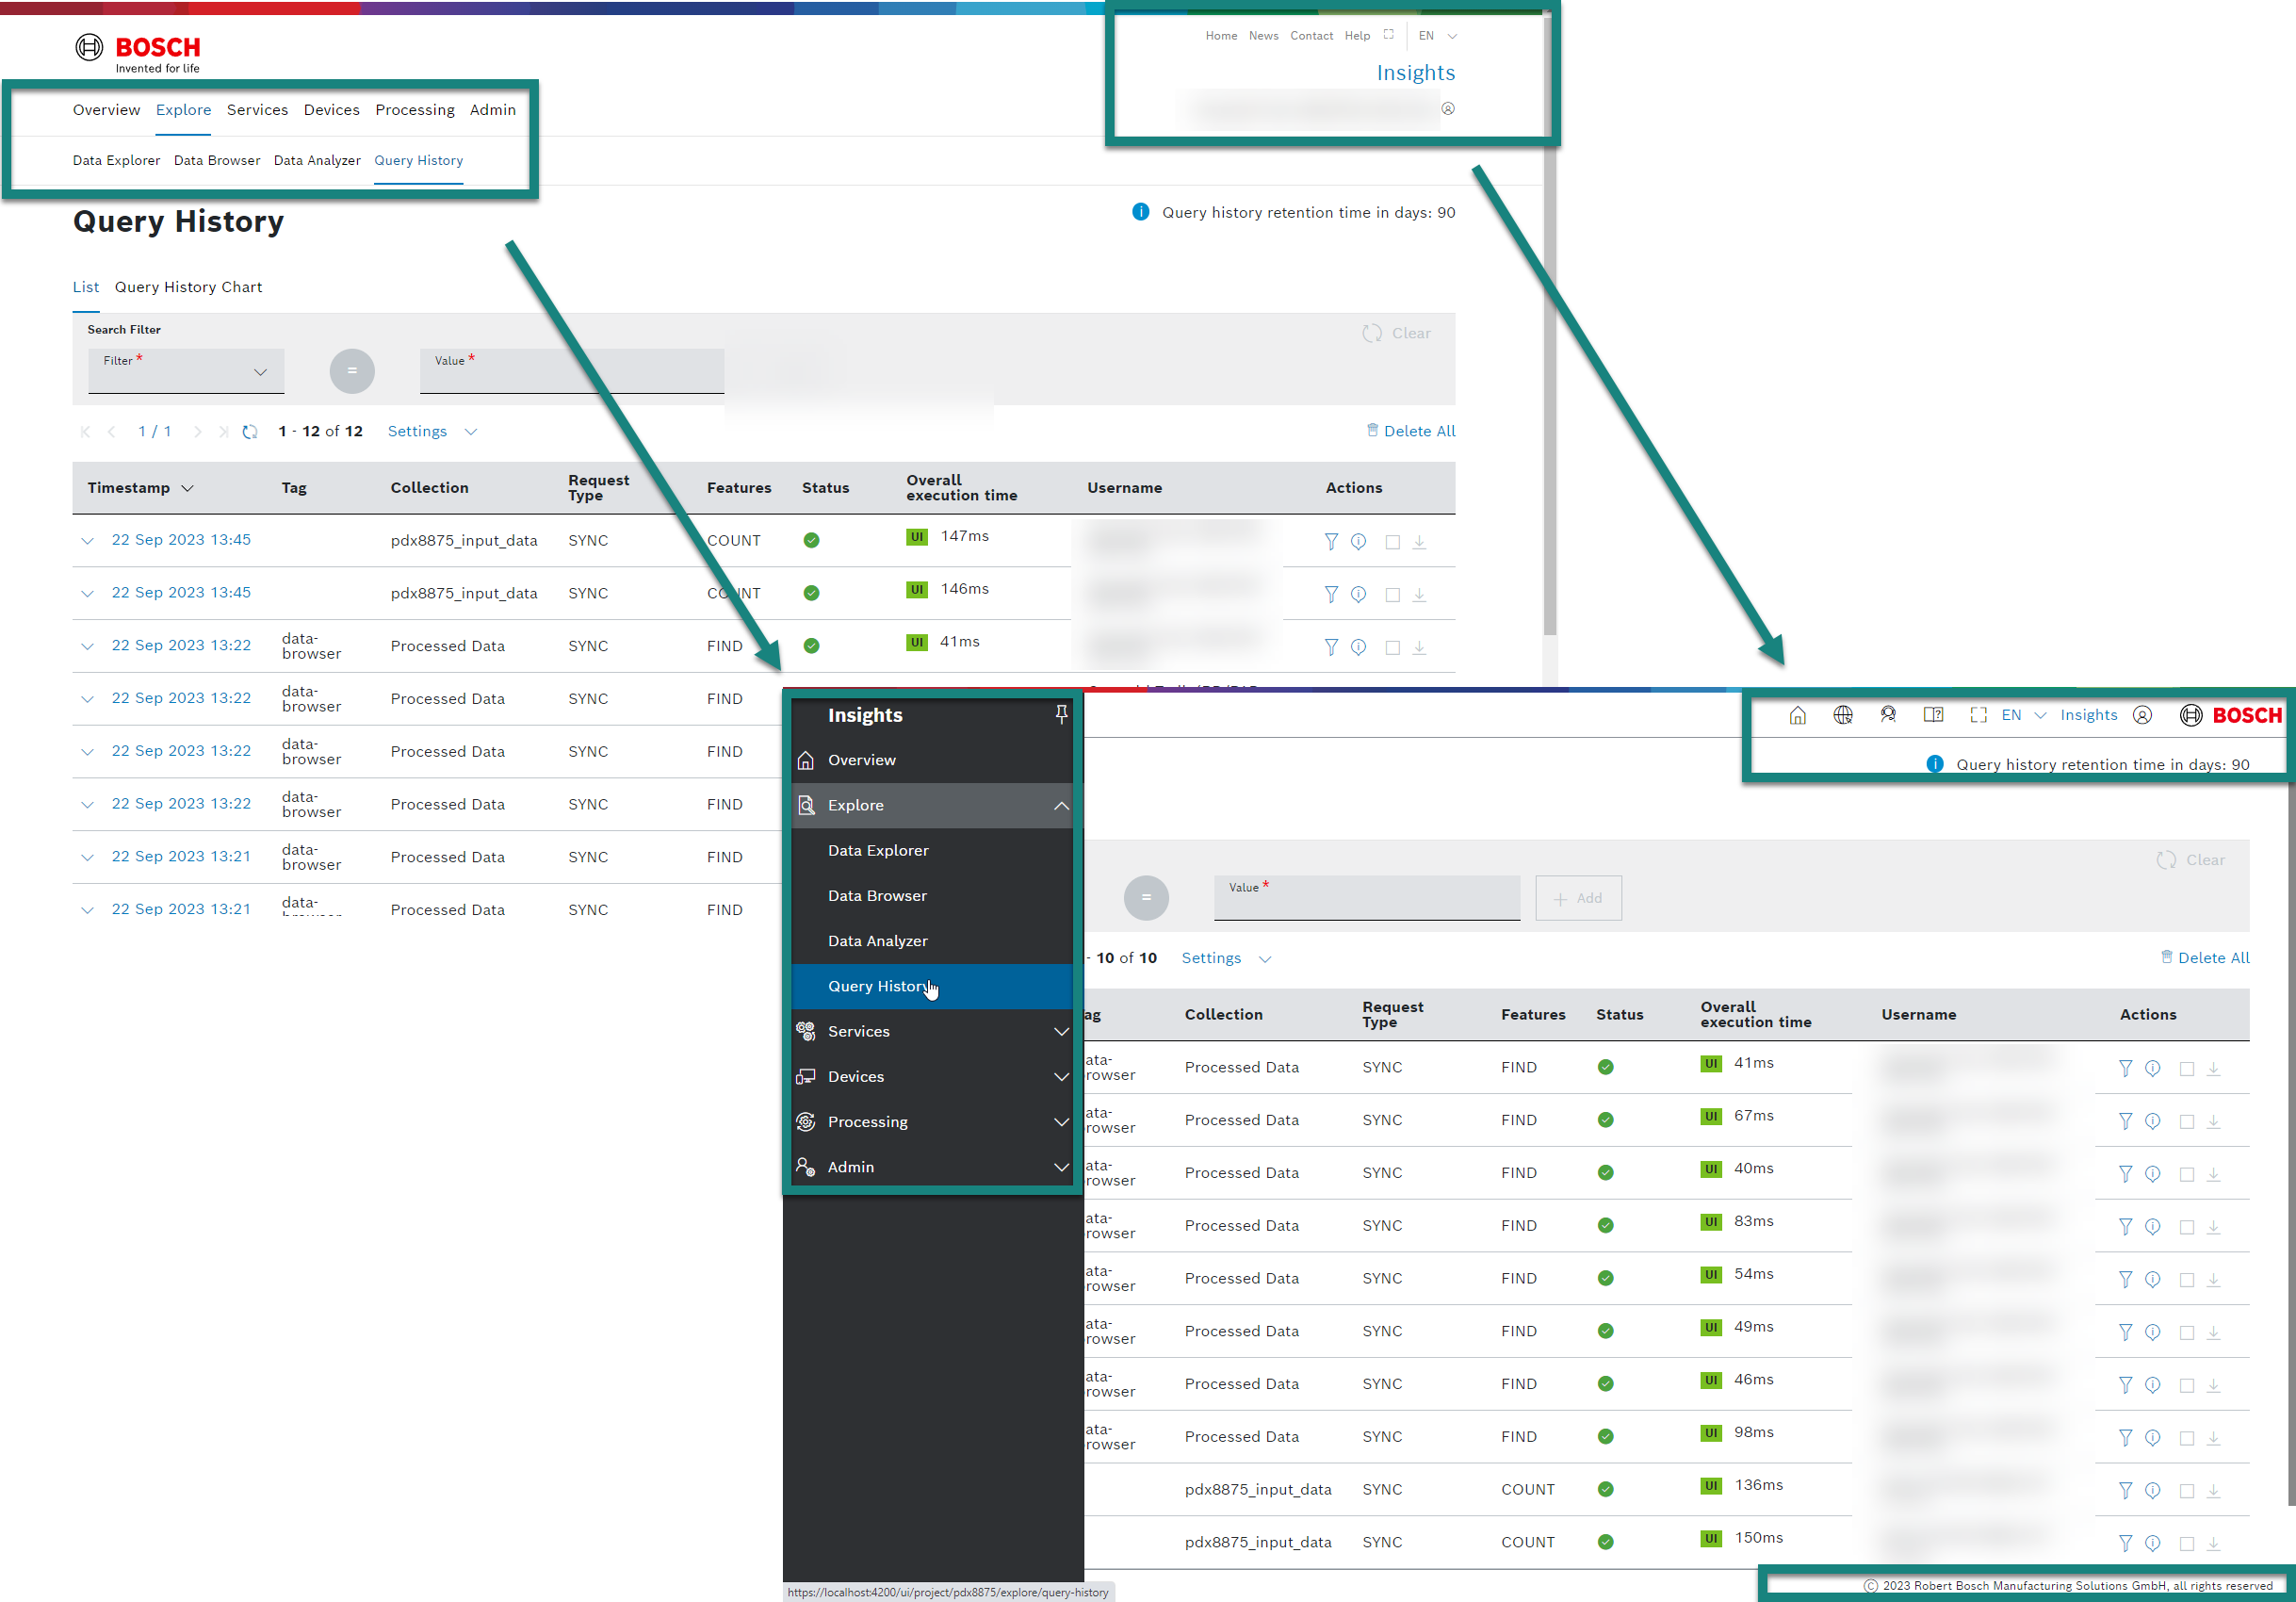
On December 4th, we are introducing a new layout in Bosch IoT Insights with a whole new menu structure. See all the benefits and what the new layout will look like below.
Benefits:
- Expandable/collapsible menu
- Removal of borders in the current web page layout for a better use of the available space
- Rework of general icons to easily identify their purpose
- Reduction of information that doesn’t need to be visible at all times, such as your name and contact information
- No menu wrap with too many menu items
- Permanent visibility of the footer even when scrolling
- More application-focused style
- Better display on wide-screen monitors
- Better support for mobile devices
New layout:
Check out the new layout compared to the current one in Bosch IoT Insights.
Also see the collapsed navigation bar and the new allocation of the global links in the header.
The login also moved to the header.
November 29, 2023: Maintenance window for migration of managed Bosch IoT Things instances to Ditto
As announced on November 15, 2023 we are going to migrate Bosch IoT Things instances, which are managed by Bosch IoT Insights to Ditto.
Maintenance window:
From: December 13, 2023 08:00 AM
Until: December 13, 2023 10:00 AM
During the maintenance, projects that use device management within Bosch IoT Insights and do not bring their own Bosch IoT Things instance,
will experience an interruption for modifying requests to create/update/delete devices. For projects in question, we will shutdown running processing pipelines
and restart them again when the maintenance is finished.
November 15, 2023: Migration of managed Bosch IoT Things instances to Ditto as device management backend
Devices of all projects that use a Bosch IoT Things instance managed by Bosch IoT Insights will be migrated to Ditto.
This is necessary because the Bosch IoT Things service on Azure will be discontinued at the end of the year.
On project creation, Bosch IoT Insights automatically subscribes a Bosch IoT Things instance on Azure, which is used for device management features.
Projects that configured their own Bosch IoT Things instance (e.g. instances booked as Bosch IoT Device Management package) are not affected by the migration.
The migration of all existing plans is planned before Christmas.
A maintenance window of 1 hour will be required for the migration. During this time, the usage of “Devices” will be interrupted for affected subscriptions.
After the migration, direct access from processing pipelines to Bosch IoT Things API on Azure (https://things.eu-5.bosch-iot-suite.com/api/2/*) will no longer be possible.
Device access via the Bosch IoT Insights API (https://bosch-iot-insights.com/iot-things-api/<my-project>/2/*) will be available as usual.
The concrete maintenance window will be announced soon.
Device management features for new Bosch IoT Insights project bookings are available as usual after the migration and will be continued in full in Ditto.
October
October 19, 2023: Project-wide announcement banner and more improvements
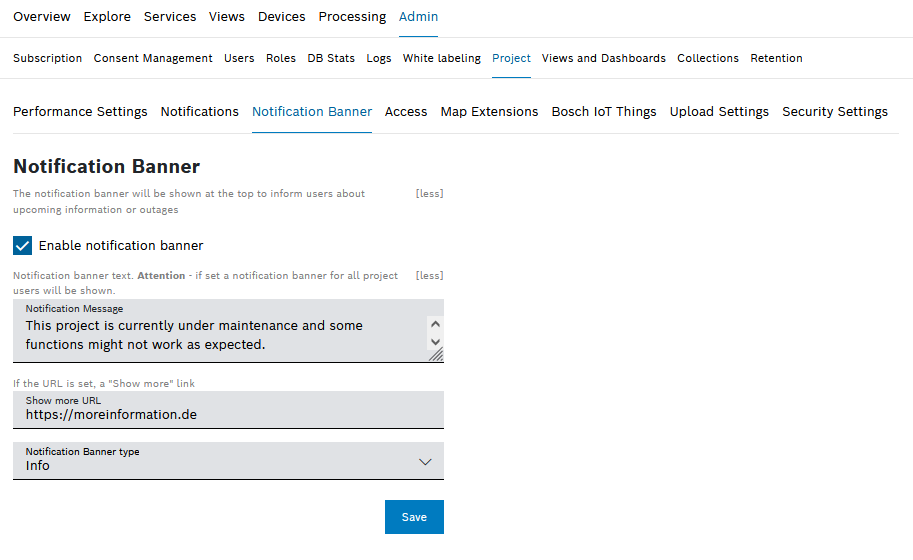
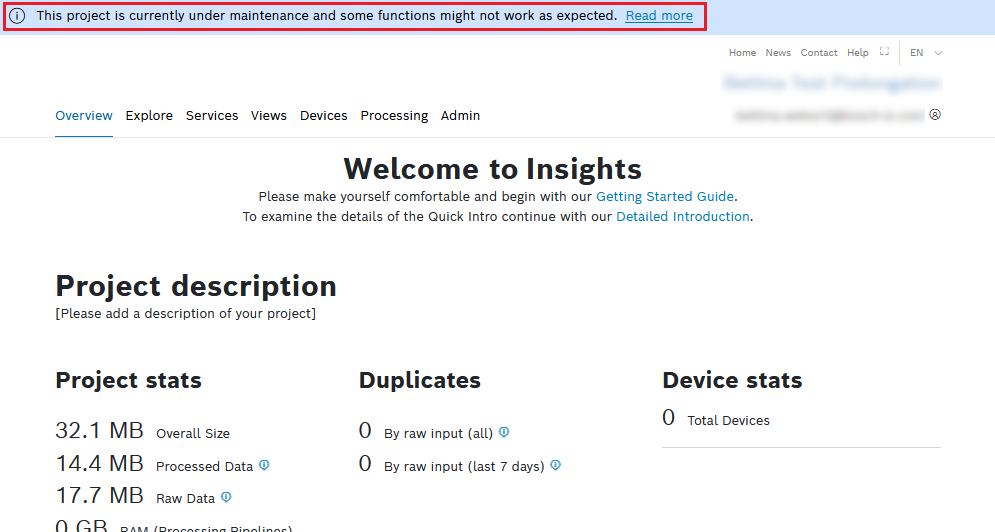
Project-wide announcement banner (Notification Banner)
As you know, Bosch IoT Insights has the option to include external data sources and many more.
As we are part of a system only seen as a single application, outages in this regard are perceived as an outage of Bosch IoT Insights even if the connected system is not available. In such situations, a project administrator is now able to inform the users of their projects by adding a notification banner, as shown on the screenshots below.
Whitelabeling: Menu restructuring
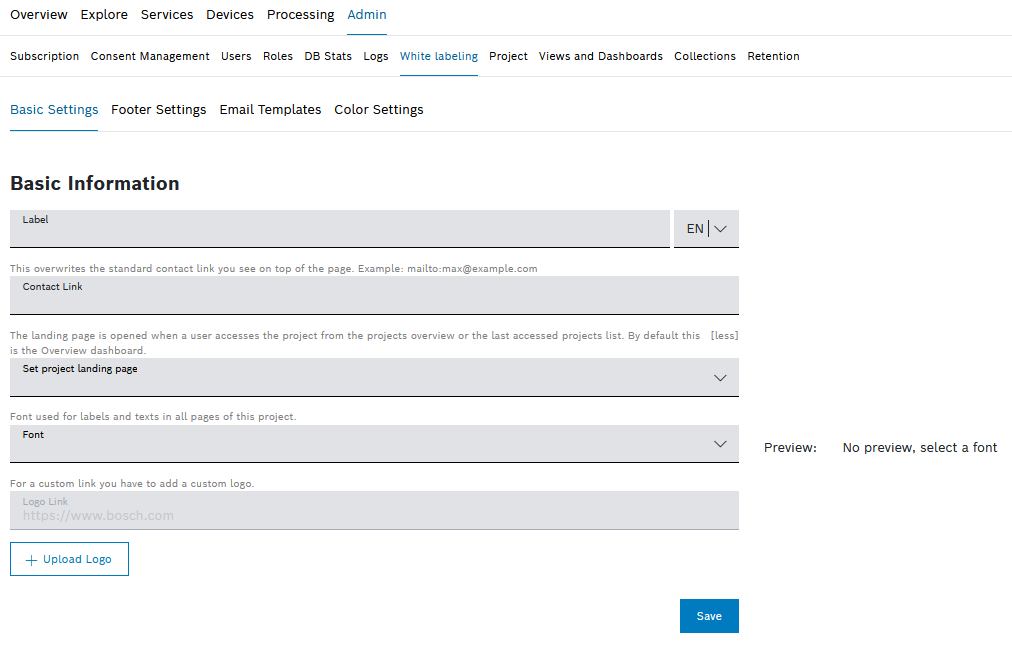
As part of efforts to increase the customization possibilities (e.g. custom domain and individual login page), we now offer a dedicated menu entry called White labeling in the Admin section. The following contents were moved from Admin > Project to White labeling:
- Basic Information (from former site General Settings)
- Footer Settings
- Email Templates
- Color Settings (former Style Settings)
The font setting was moved from Style Settings to Basic Settings. The other content of the former site General Settings was split into Performance Settings and Notification Banner.
Hide edit options for widgets if there are no options available
The widget context menu on GRID-Layout Views will now react smarter. If the current user does not have any edit rights, the option will not show up for them. Also, if no selectable options are available within the context menu, it will be hidden completely.
Action Button: Disable on specific condition
In the Action Button widget, the element Disable on specific condition has been reworked and supports multiple disable conditions now. You can choose and pick different operators and data types to compare your data.
Use tab navigation in Tab widget to support many tabs
The Tab widget was updated to support scrolling when the items take more space than the available one.
REST Requests: User can access our APIs directly
In the Action Button widget, there is now a new authentication type called "Current User Session" for Rest Requests. It will only work for Insights API Request URLs that belong to the current project.
Further Improvements
- Time series data processing - MDF should be supported out of the box
- Table Widget - Conditional formatting for relative time format with relative values
- Use thumbnails inside of widgets instead of full-size device images
- Calendar Widget - Fetch images in the background
- Calendar Widget - Default device filter is limited to 50 devices, not 200
Bug Fixes
- INS-5792: No option to remove custom condition in query template
- INS-5560: Time series data processing - support processing arrays in input data
- INS-5868: Filter-Widget-Edit - Broken device filter for general device filter
- INS-5838: Action Button shows the wrong rest request authorization type
- INS-5883: URL Filter parameters not stored when saving in widget editor mode / removed after save
- INS-5890: Table Widget - Pop up window is not shown completely
- INS-5940: "Hidden" Tab should not be visible in Tab Widget Menu
September
September 25, 2023: New layout preview
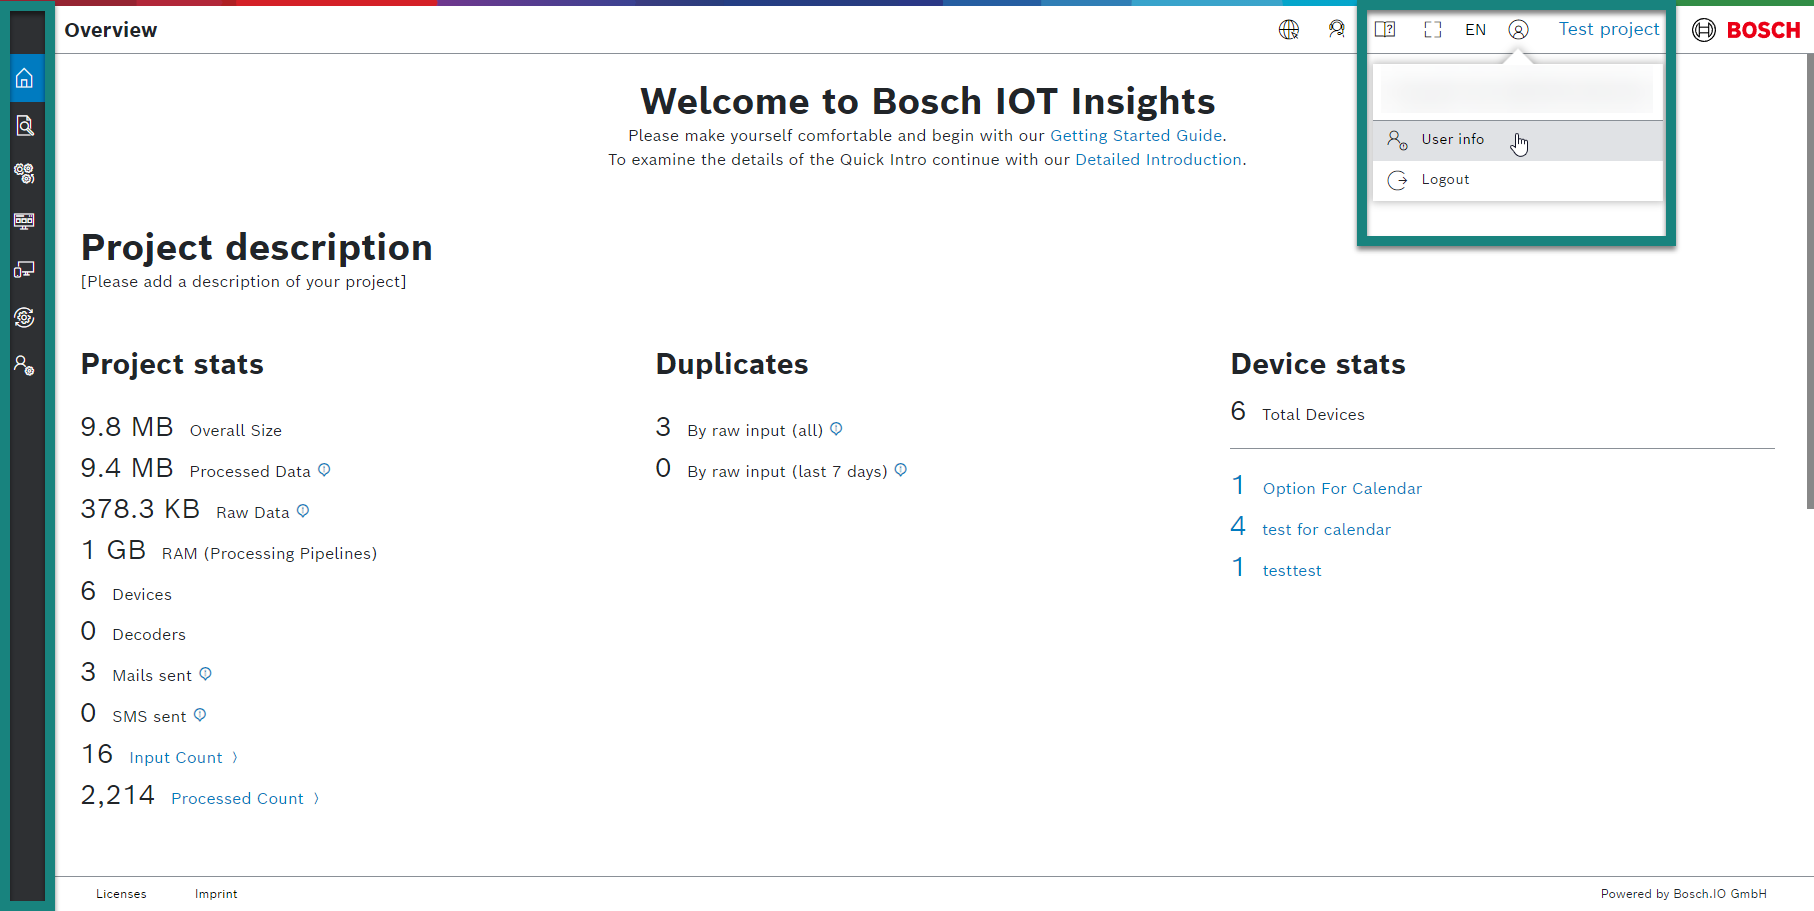
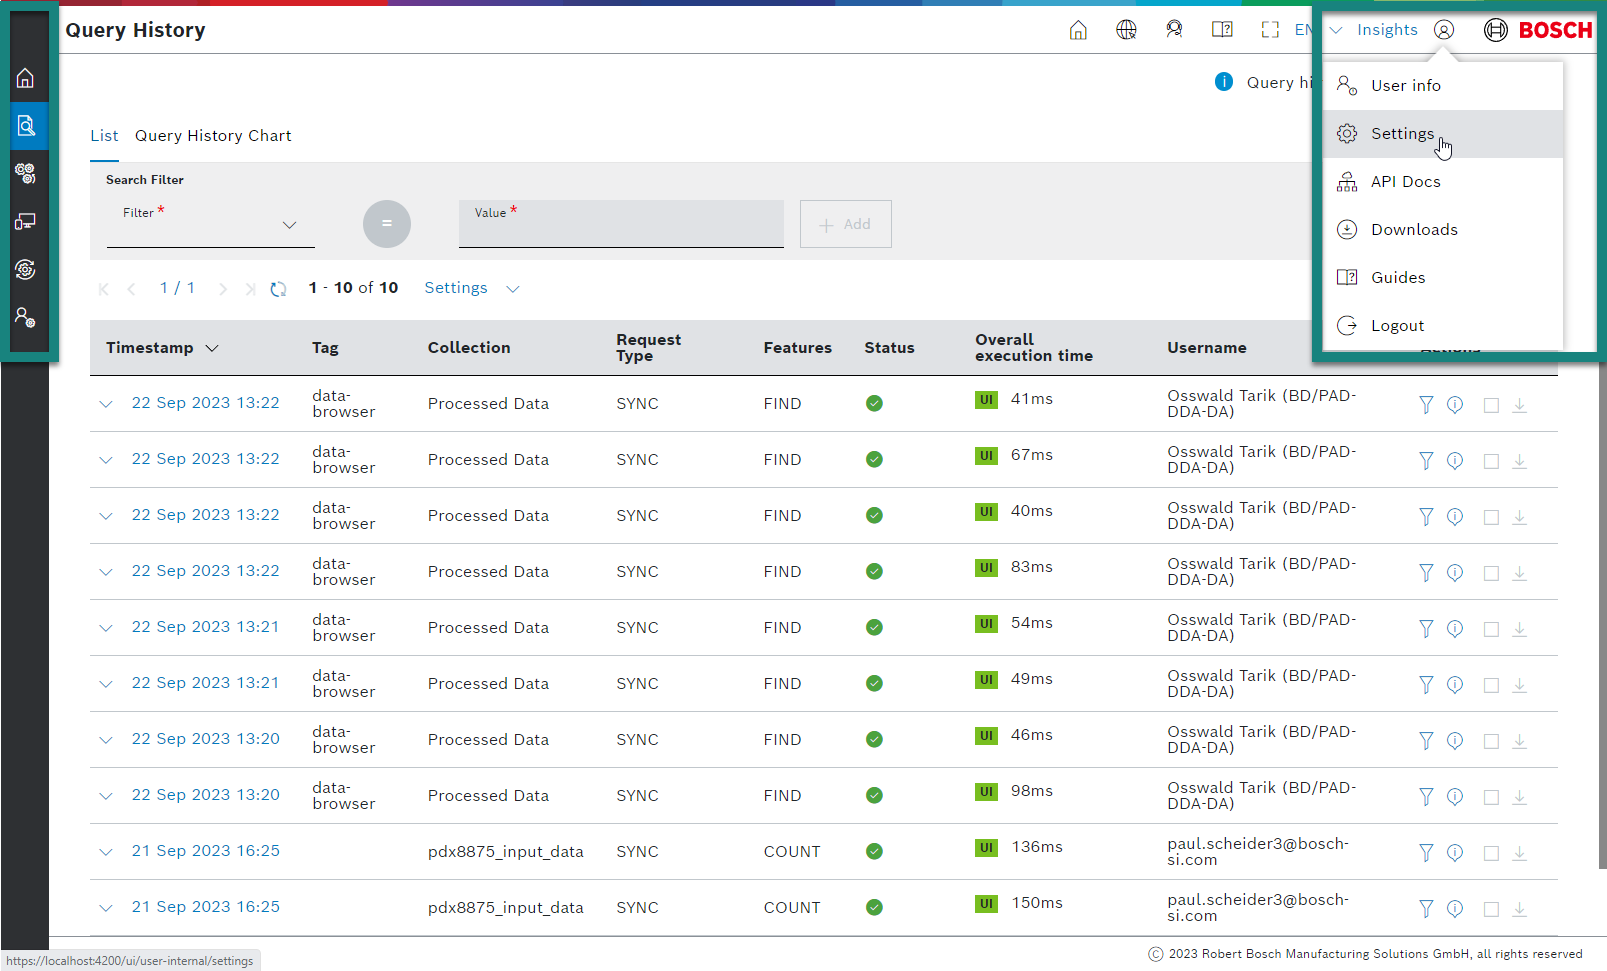
Soon we are introducing a new layout in Bosch IoT Insights with a whole new menu structure. See all the benefits and a sneak peak of what the new layout will look like.
Benefits:
- Expandable/collapsible menu
- Removal of borders in the current web page layout for a better use of the available space
- Rework of general icons to easily identify their purpose
- Reduction of information that doesn’t need to be visible at all times, such as your name and contact information
- No menu wrap with too many menu items
- Permanent visibility of the footer even when scrolling
- More application-focused style
- Better display on wide-screen monitors
- Better support for mobile devices
New layout:
Check out the new layout compared to the current one in Bosch IoT Insights.
Also see the collapsed navigation bar and the new drop-down that hides the user information.
September 18, 2023: Scale Up Button, Widget Improvements and more
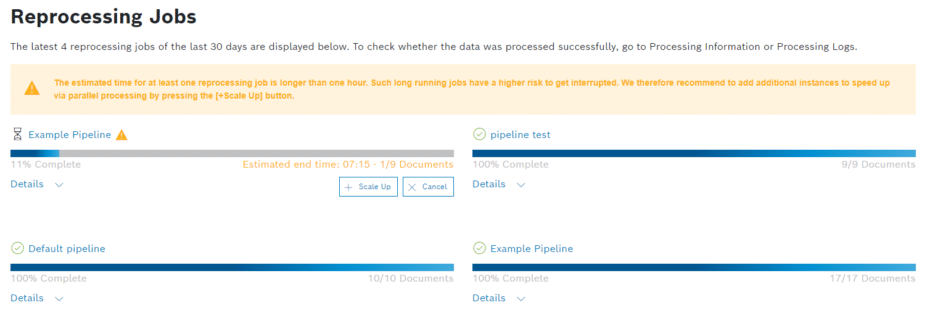
"Scale Up" button for reprocessing Jobs
The newly introduced "Scale Up" button gives project administrators the possibility to speed up reprocessing jobs, which are currently running.
After a reprocessing job is created, the button is not displayed immediately: it appears once the underlying execution is running and the cloud environment is created. This will usually take about one second.
The small delay was introduced to prevent undesired behavior, and to make sure that the correct amount of running reprocessing instances is displayed to the project administrator.
Additionally, the memory consumption is displayed, so that project administrators can evaluate the corresponding costs.
Renewal required for extended usage of free plans
Currently, a lot of free plan projects in Bosch IoT Insights seem to be not in use anymore. The free plan is designed to be used for testing and evaluation. To provide you the best possible service also for a long term usage, we recommend an upgrade to a PayAsYouGo plan. A PayAsYouGo plan contains the same include volumes as a free plan and has no base fee. Find details at https://bosch-iot-suite.com/service/insights/#serviceplans.
From now on, project administrators of free plan projects will have to renew their subscription on a regular basis. In case a renewal is required, the project administrators will receive an e-mail which will inform them that they have to login and renew their subscription. If they renew their subscription, they can use Bosch IoT Insights for another 30 days. Otherwise, after 30 days, we will assume that the project is not needed any longer and will delete it.
The renewal can be requested by clicking on the link in the banner on top of the browser window. Doing so, a confirmation message about the successful renewal will be displayed, and the banner will not be shown anymore for further 30 days.
New feature to set custom retention times for processing status information
Project administrators can now define an automatic deletion of processing information.
The new introduced option of processing status collection is offered in the project settings under the retention tab.
The possible time range is between 7 and 9.999 days. All existing deletion indexes have been aligned on the new field and minimum time range.
Maximum Retention Time
To prevent to exceed the Mongo ttl index time limit. we limited the retention time to a maximum period of 9.999 days, which is equal to ~27,4 years. All projects with higher retention times have been limited to this value.
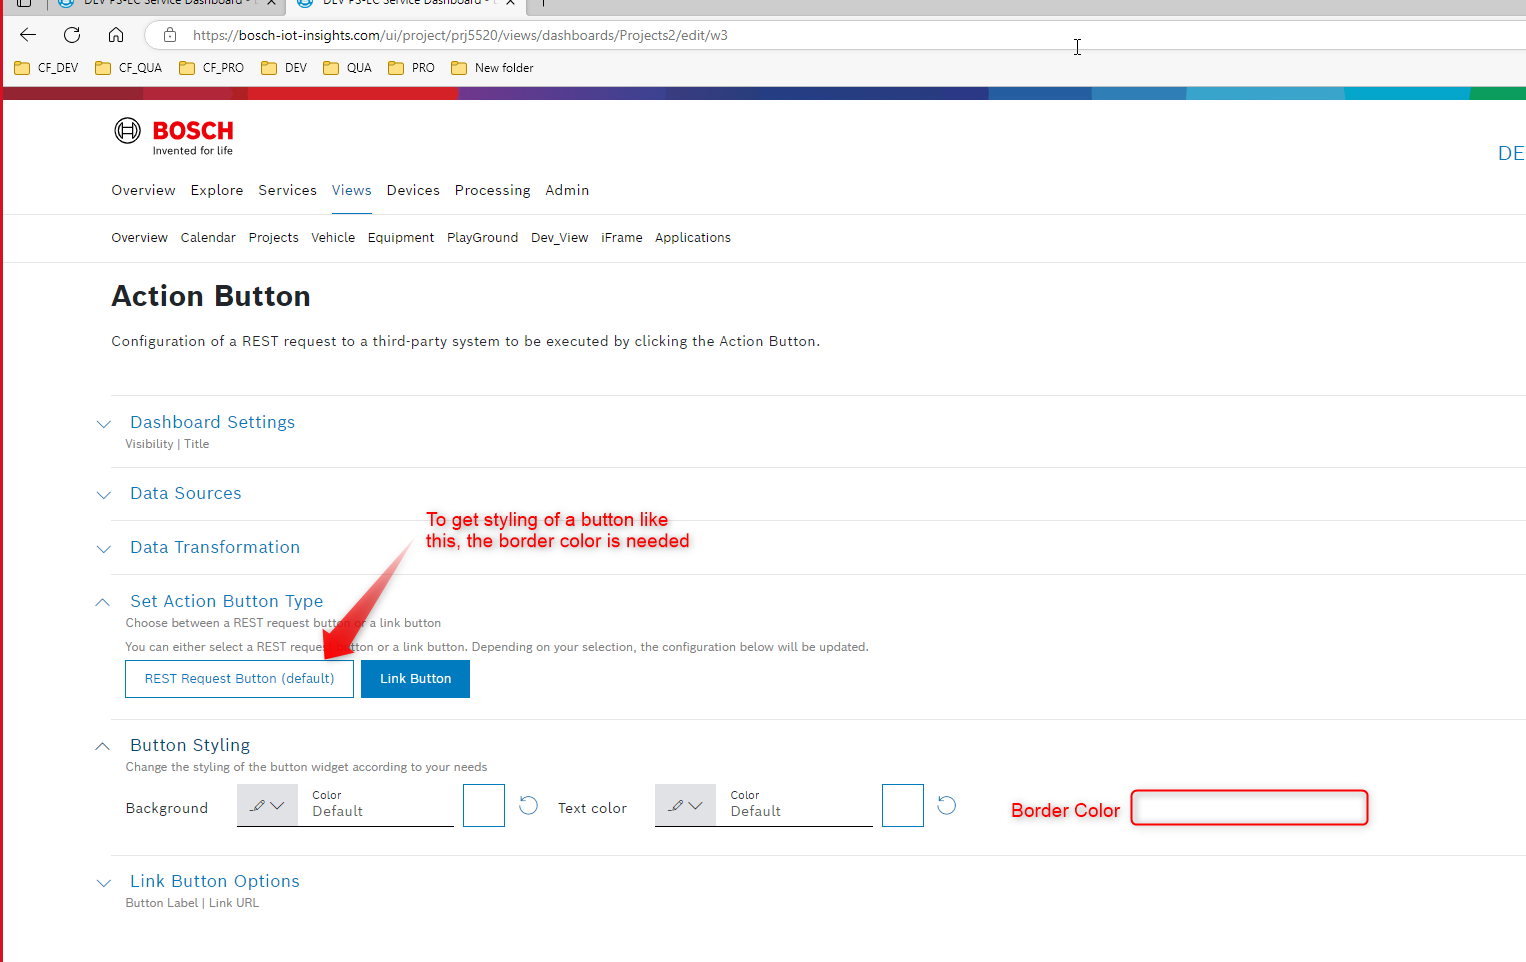
Action Button Widget Improvements
More possibilities have been added to the REST request option in the table widget, and in the action button widget. You can enter a placeholder containing the https-protocol and select a condition to disable the button or link.
Moreover, the new border color option can achieve to set a specific border color for each button, aligning with your unique design requirements, and enhancing visual contrast and design flexibility.
Tooltip with Dynamic Content for Table Widget
You can now add a tooltip with dynamic content in the table. Each custom column can have its own tooltip, which also supports data placeholders.
Optimized query error handling of query template
The error handling for queries and query templates has been refactored, and now provides user friendly text, with helpful and understandable error messages.
Further Improvements
The table widget's design was improved to make it clearer to which column the filter icon belongs.
In the context of the grid layout, it is now possible to vertically enlarge the rich text widget more than it's content.
The tab widget was updated to support scrolling when the items take more space than available.
Support for WebSocket connections in Analytics specific frontends was added.
The default clustered index of a timeseries collection is now shown in the template editor and data analyzer.
Users can now access our APIs directly by using their current session for authentication.
Bug Fixes
In this release, we have addressed and fixed the following bugs:
INS-5735: Navigation issue when stay on the same dashboard, but changing the URL query parameter
- INS-5830: Device History linked devices section remains empty
- INS-5435: Table Widget - Custom Column with Rich Text - CSS "line break" splits words
- INS-5524: Calendar Widget - Device Details are not shown when switching between projects
- INS-5807: Explain and analyze doesn't consider hints
August
August 30, 2023: Table widget improvements and many more
Fixed a performance bottleneck for the file upload in the UI
We found uploading files through our UI and API using HTTP 2.0 to be slow. Therefore, a downgrade of the existing domains were set to enforce the usage of HTTP 1.1 for now. With this, we were able to fix the performance bottleneck, and the user can now upload large files, which will be uploaded via the UI as fast as possible.
We plan to provide HTTP 2.0 in the future again when a corresponding solution by the infrastructure services is available to address this bottleneck in HTTP 2.0.
Processing pipeline shows the correct status for failed pipelines
If a processing pipeline crashes, the processing status for the document might remain in "IN PROGRESS". Especially when it failed to update the status. Previously, the UI showed them as "spinning" forever symbols and gave the false impression that the document was still being processed.
We implemented a job scheduler that checks for those false states and updates the status to "COMPLETED_WITH_FAILURES". The job validates the status information every 30 minutes. The job searches for status documents with the status NEW or RUNNING and compares them with the current processing pipeline instances.
If there is no pipeline instance for the document, it is considered as orphaned, and its status is updated. Thus, a failure is displayed in the UI instead of the "spinner". With this improvement, the user always sees the correct status of his pipelines.
Renewal is required for extended usage of free plans
Currently, a lot of free plan projects seem to be not in use anymore.
The free plan in general is designed to be used for testing and evaluation.
To provide you the best possible service also for a long-term usage, we are now sending out a recommendation an upgrade to a PayAsYouGo plan.
A PayAsYouGo plan contains the same volumes as a free plan and has no base fee.
From now on, project administrators of free-plan projects will have to renew their subscription on a regular basis.
In case a renewal is required, the project administrators will receive an e-mail which will inform them that they have to log in and renew their subscription. If they renew their subscription, they can use Bosch IoT Insights for another 30 days. Otherwise, after 30 days, we will assume that the project is not needed anymore and delete it. The renewal can be requested by clicking on the link in the banner at the top of the browser window. Doing so, a confirmation message about the successful renewal will be displayed and the banner will not be shown anymore for another 30 days.
User can configure the booking color individually
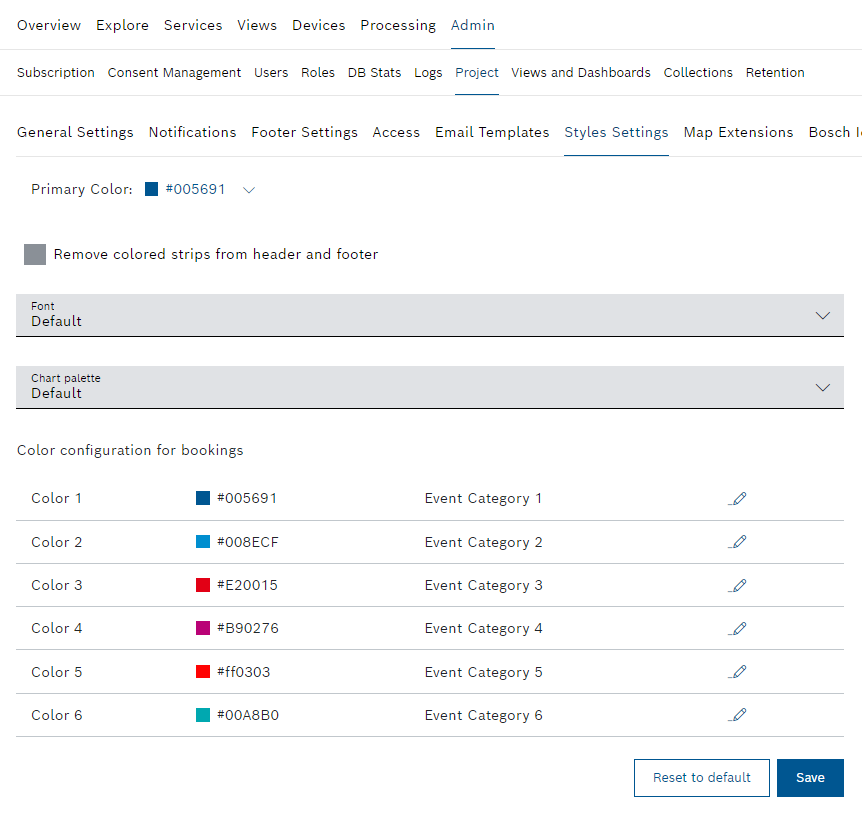
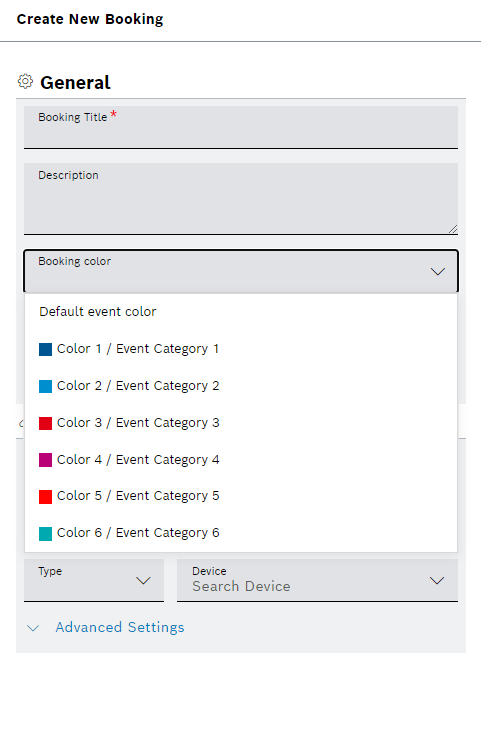
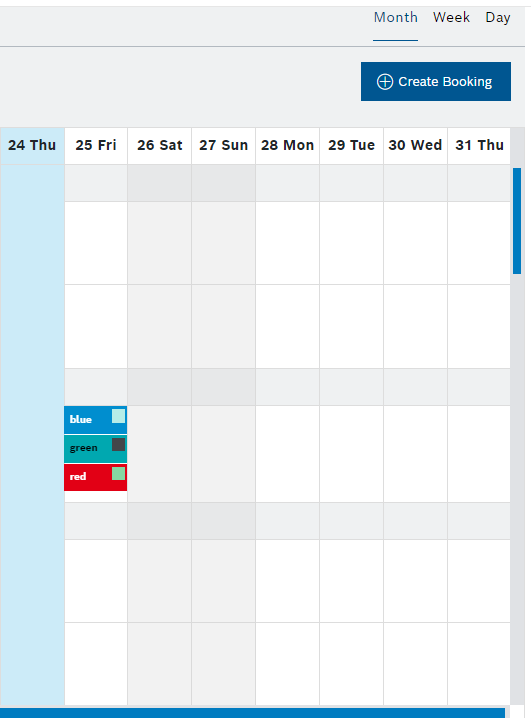
We made an improvement for the user to set an individual color for a booking to highlight specific events with a specific color.
In a booking, there is a new option when creating and editing a booking where a user can choose the color of an own booking.
The status of the booking is still visible to the user. To set individual color events, you can find a description in the Style Settings.
Ability to trigger multiple entries with an overall action button in the Table widget
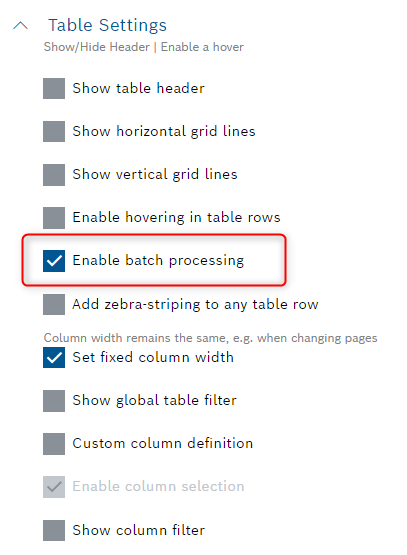
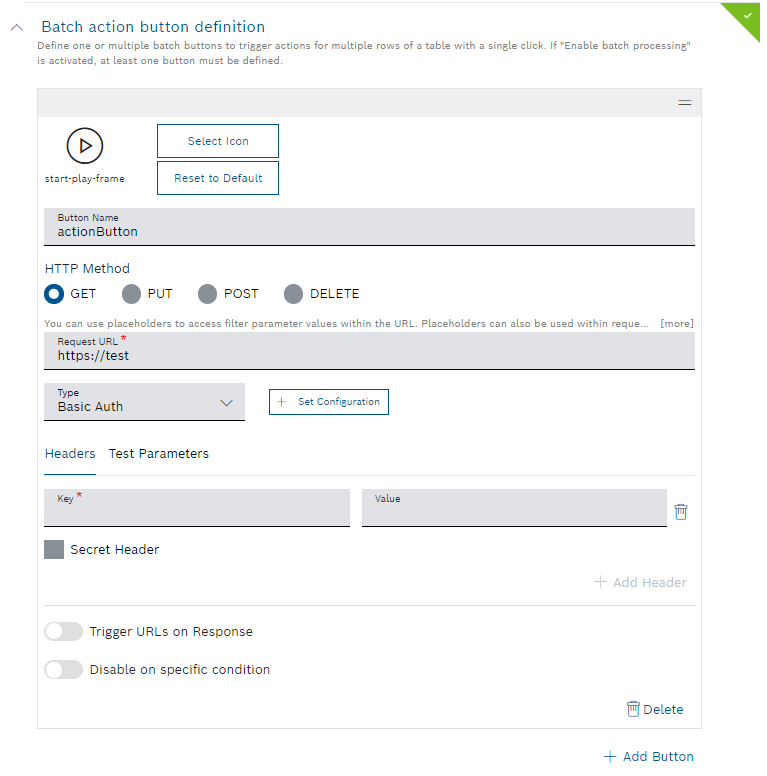
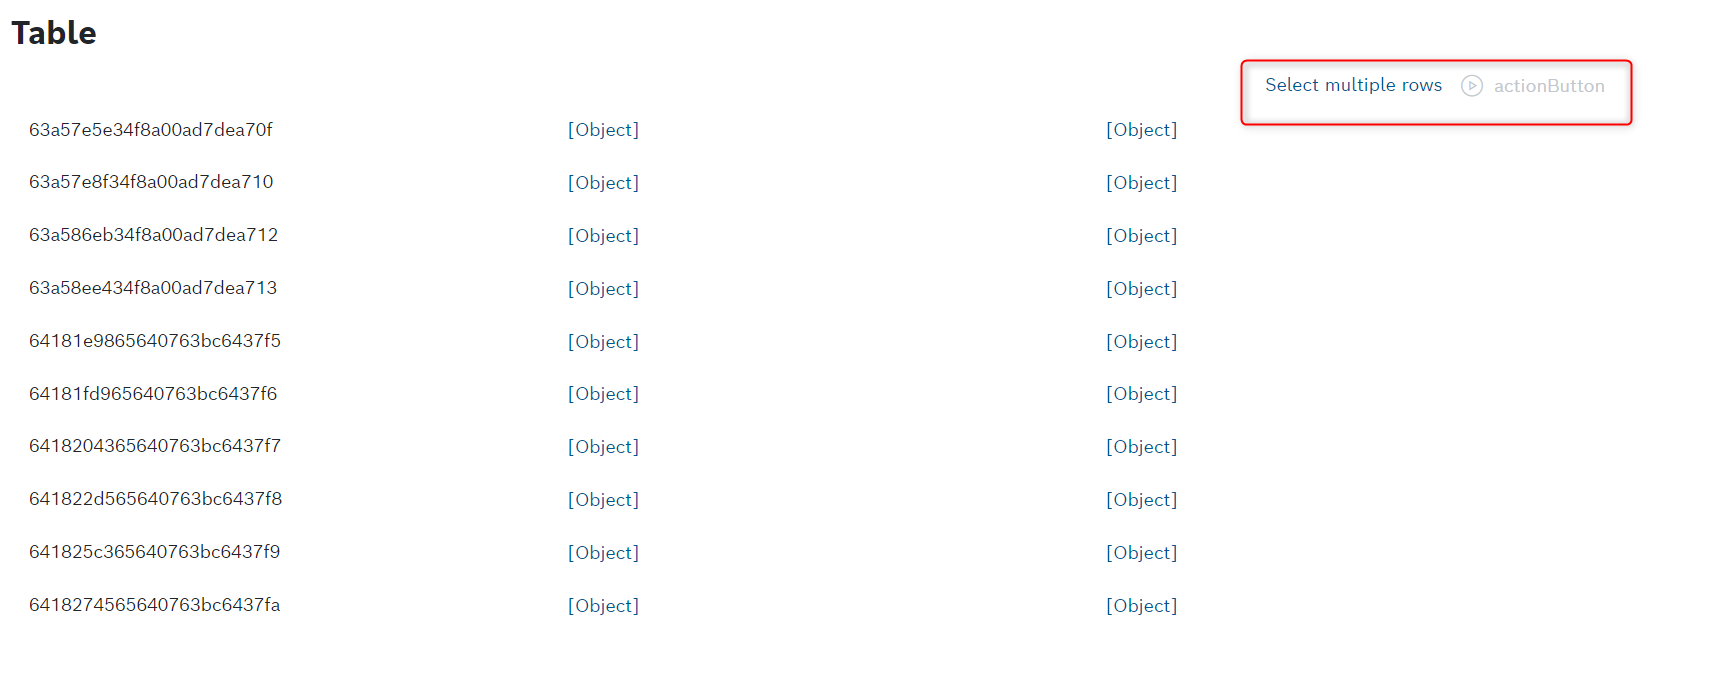
We made an improvement where users can add several action buttons in the header of the Table widget. If the user enables the "Enable batch processing" button in the table settings, a "Batch action button definition" field opens where an action button can be individually configured. To run the global action button, the user must select columns in the Table widget for which the action button will be executed.
A clear description of how to configure the action button in the Table widget can be found in our documentation under Table Settings.
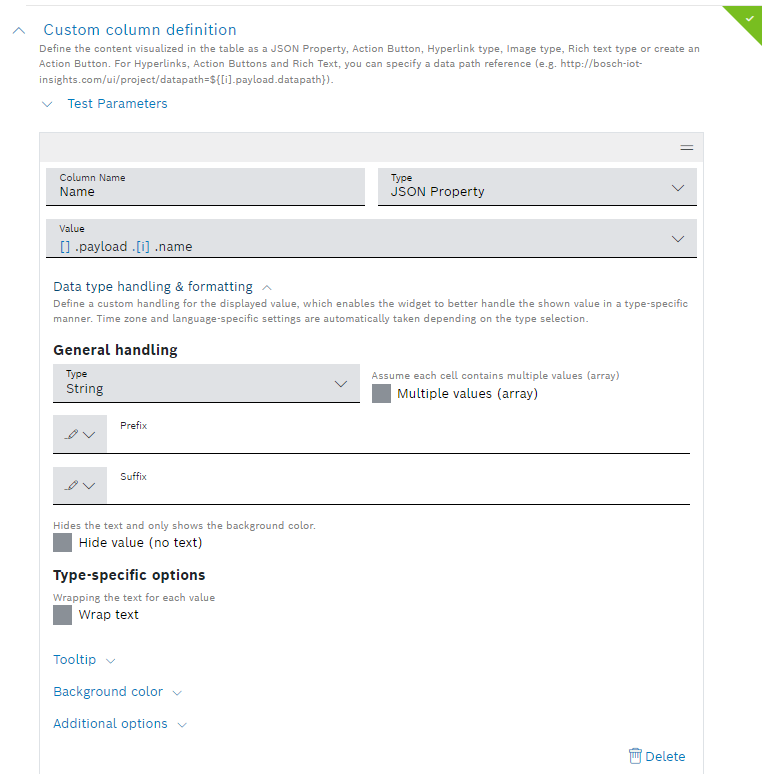
Individual background colors for all custom column types in the Table widget
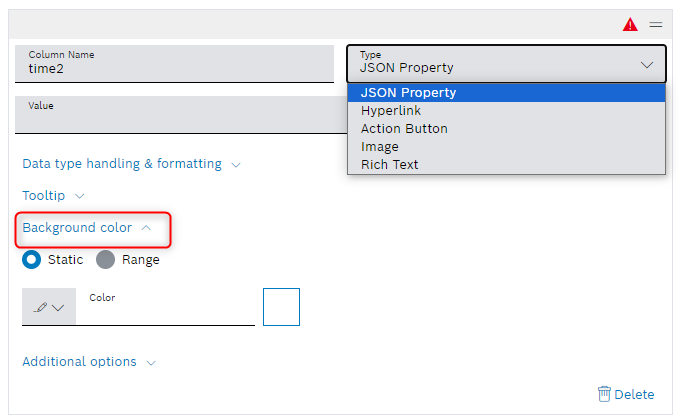
Now the user has the possibility to define an individual background color for the rich text column, hyperlink column, image column, and action button column. The setting for this new feature can be found under “Custom column definition". There is a new field "Background color" where you can define the background color for all column types.
Clear history display of changes in a processing pipeline
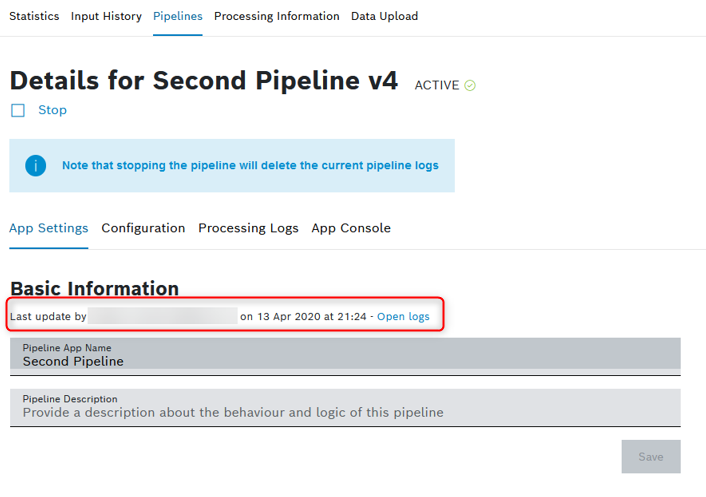
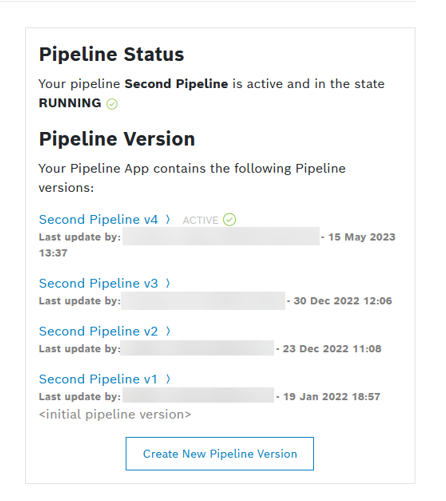
If a user opens a processing pipeline, more metadata about the pipeline is displayed. By opening a pipeline, you can directly see when and who initially created it, when and who made the last changes to it, and the previous changes. The order of the information box has been improved so that the newest version of the pipeline is displayed first giving the user direct access to the current pipeline version.
For the pipeline view, we have an additional place in our documentation at Viewing a pipeline.
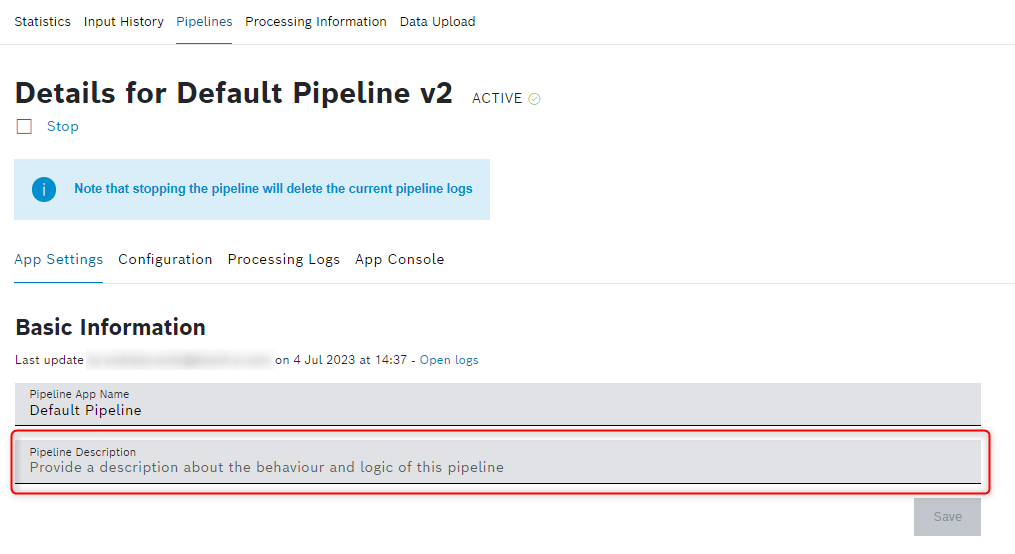
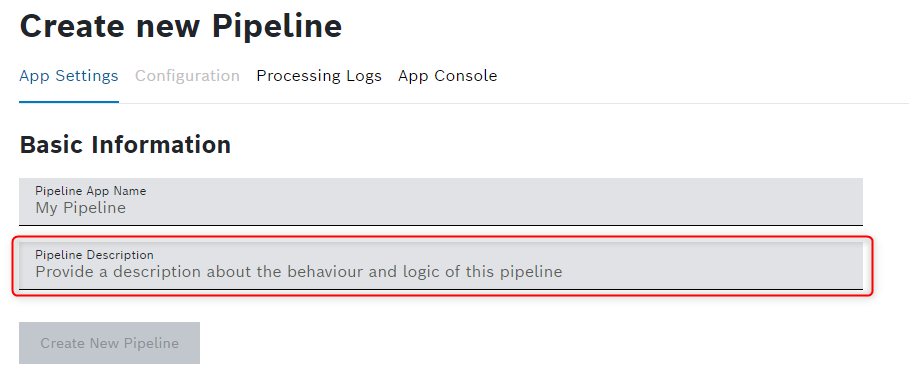
New description field for each processing pipeline
In processing pipelines, we give the user the ability to describe the respective pipeline. If a user opens a pipeline, it is now possible to describe each pipeline to provide its the purpose, behaviour, and logic.
Performance optimization for user management
We found out that in some projects, there were a lot of users on the pending invite list, which lead to slow user management in some cases. To improve the performance, we will store the entry for 30 days in the pending invites list if the invitation link expired after 14 days. After 30 days, the entry will be deleted.
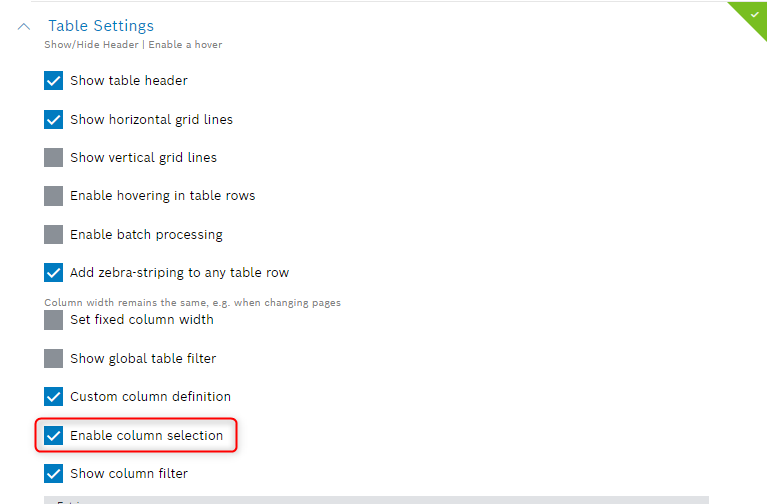
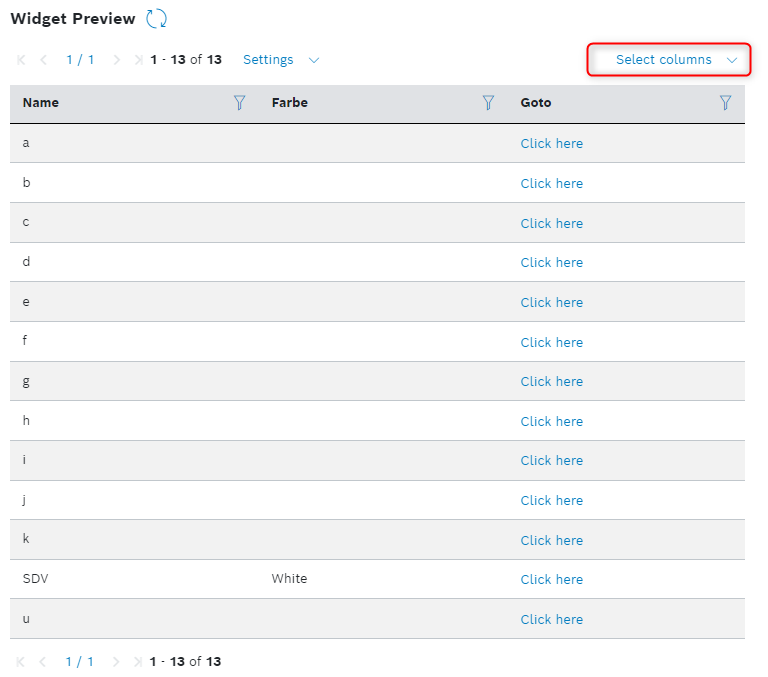
Ability to disable "column selection" in the Table widget
In the Table widget's table settings, there is a new option "Enable column selection" for the user, where the "Select columns" button at the header of the table widget can be enabled or disabled. The benefit of this option is that if the user doesn’t need the column selection, no unnecessary space is taken up.
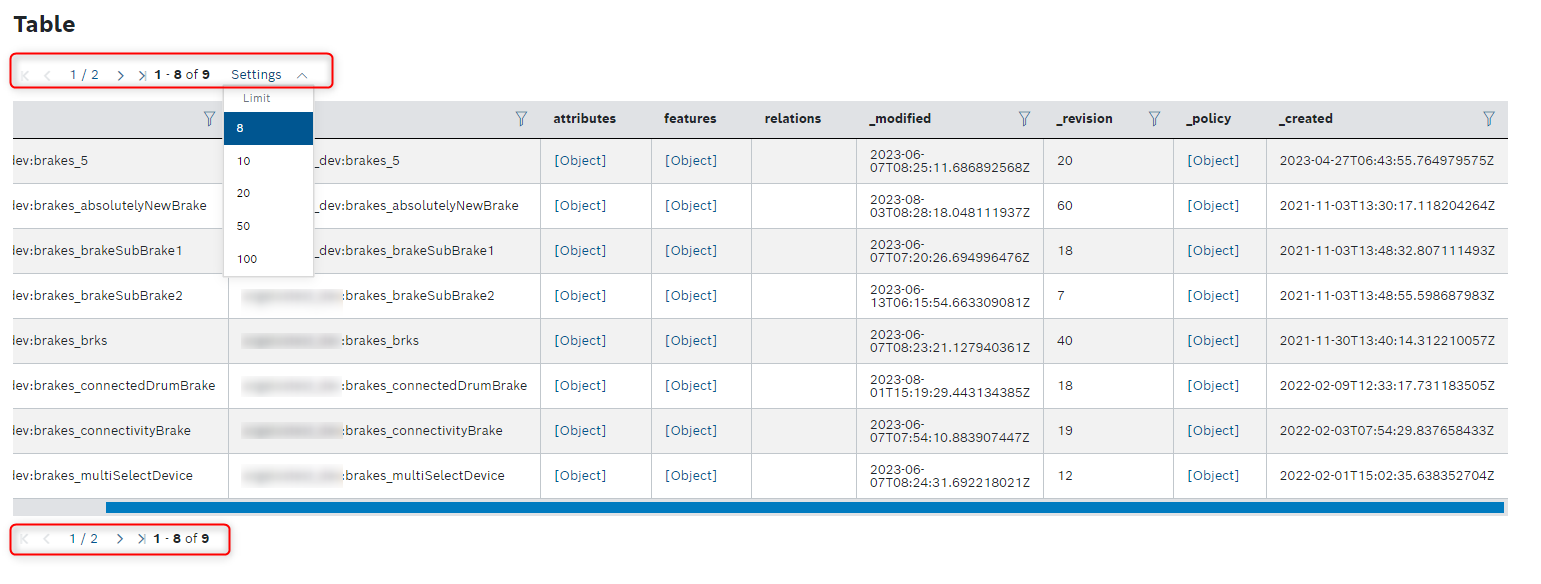
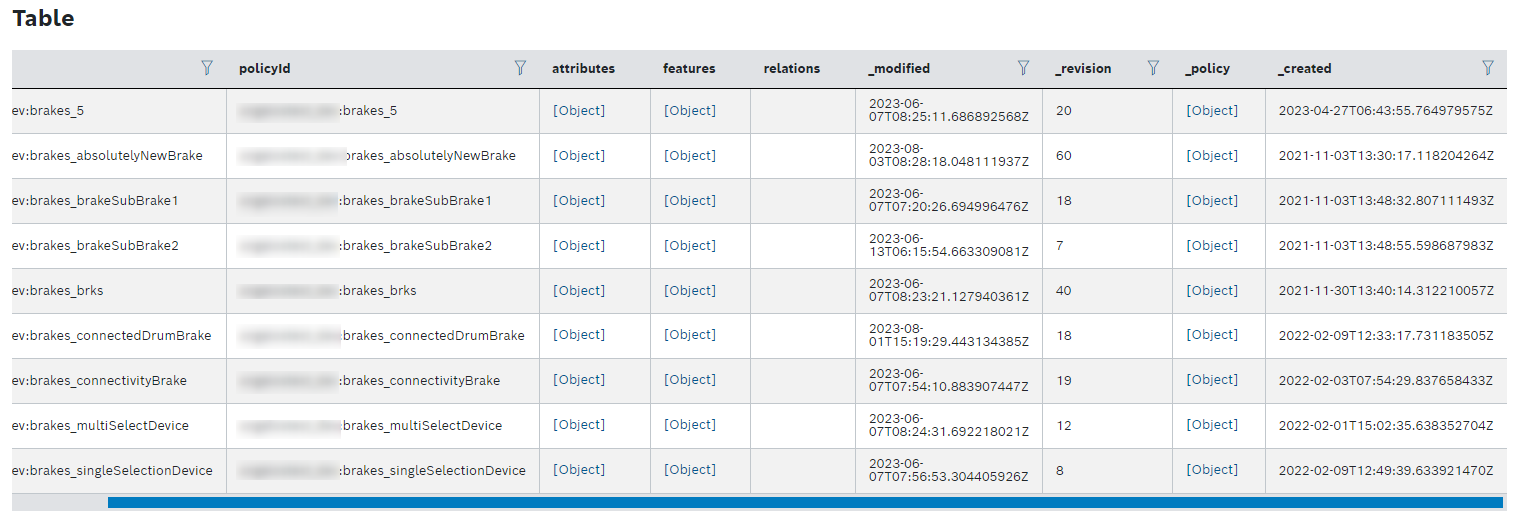
The pagination of the Table widget is not shown if it is not needed
The Table widget will occupy less space if the content of the table can be shown completely on one page. If the table has fewer than 10 entries, the setting for the entries per page is higher than 10, and the "Settings" menu only contains the page size. The pagination of the table is hidden. The benefit of this new improvement for the user is that the Table widget will use less space in the dashboard view.
Filter Panel widget - device list supports endless scrolling
We made an improvement to the device list in the Filter Panel widget that allows the user to endlessly scroll. Users can now quickly browse through the entire device list without having to click on the “Show more” button multiple times.
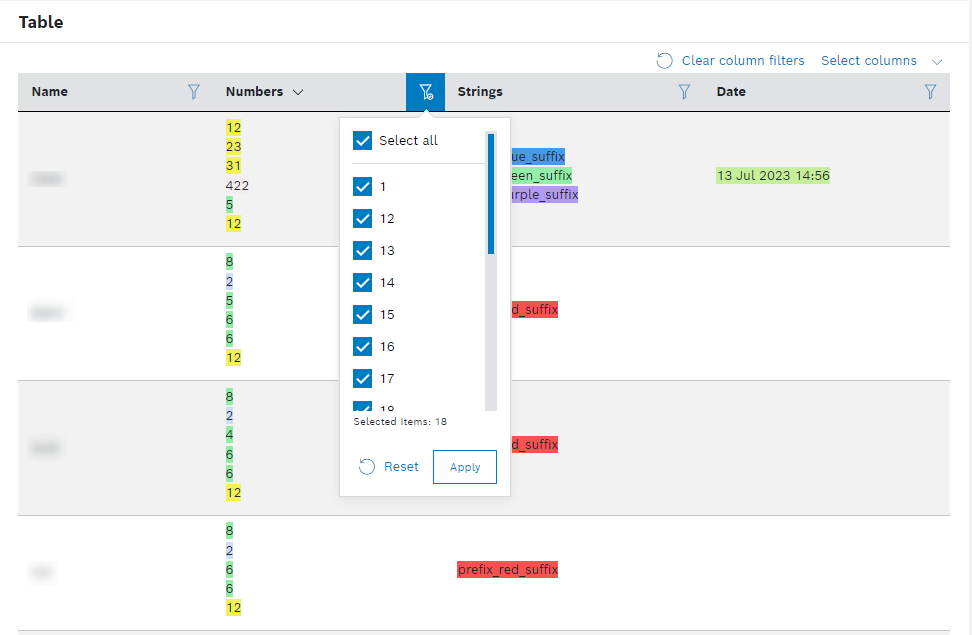
The filter in the Table widget supports now array data types
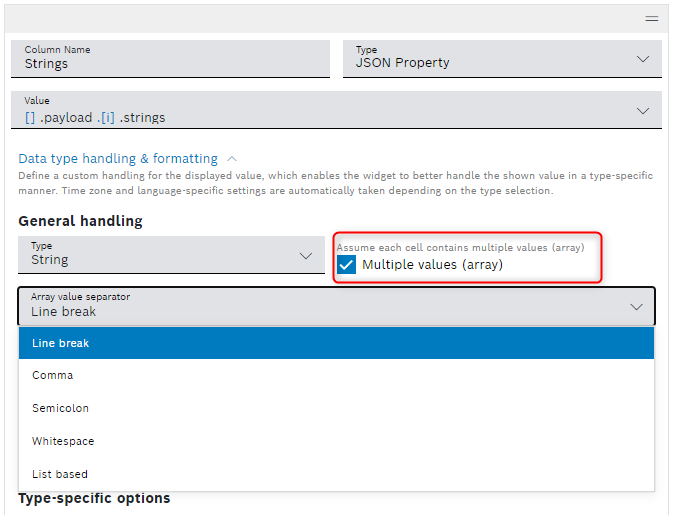
In the Table widget settings, there is now a new option to handle multiple values (arrays). Now the user can define which data type the values in an array have and filter for them. With this new improvement, users can now more precisely define which data type should be handled and get better filter results. The new option can be found at "Custom colums definition" > "Data type handling & formatting".
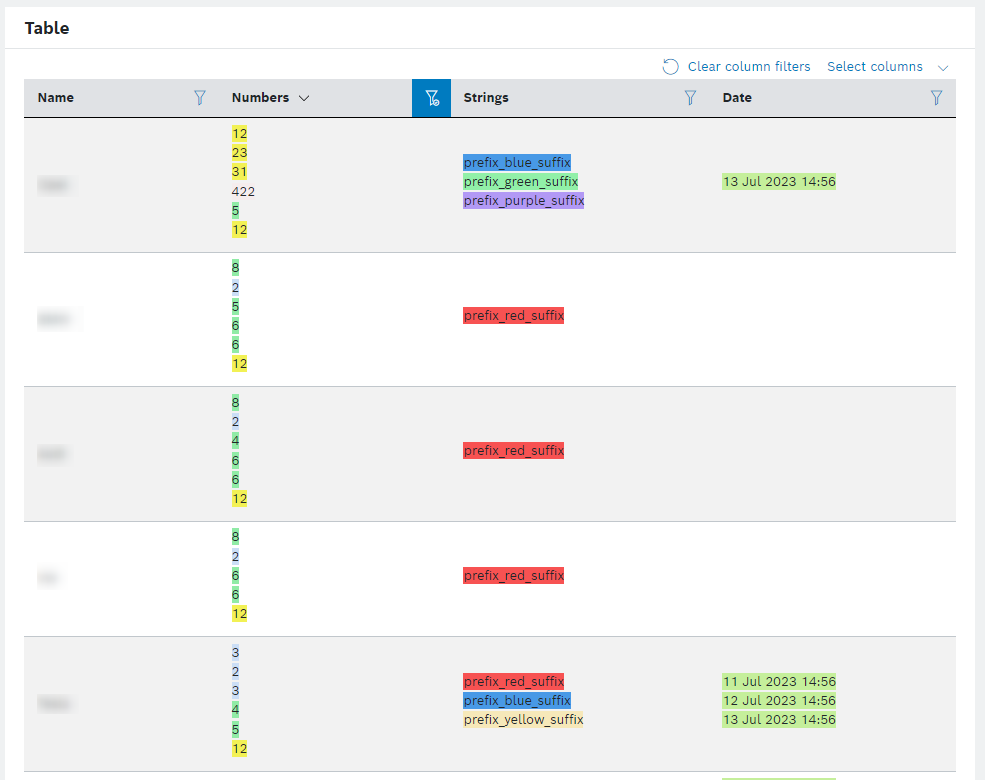
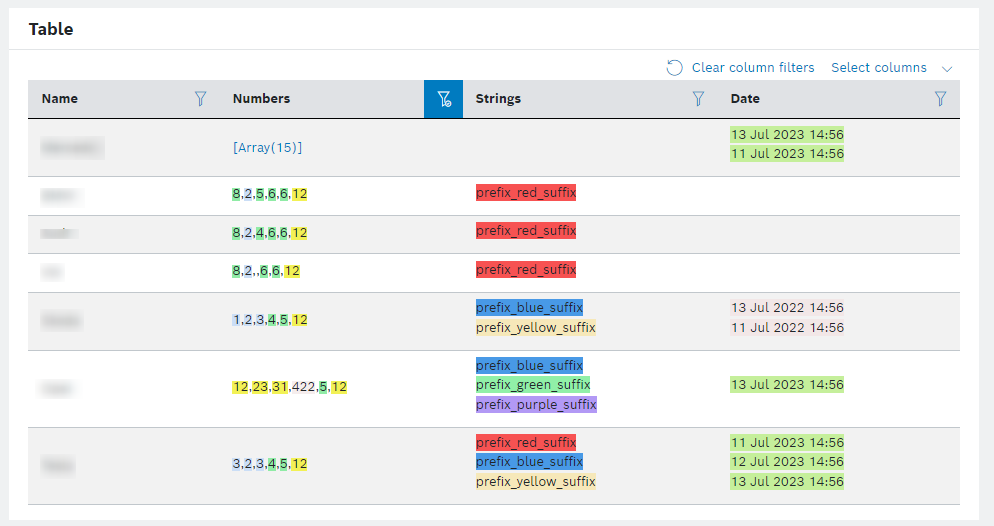
Better visualization of arrays in the table widget
Users can now better handle array data types in a table column. There is a new option when "Multiple values (array)" is selected to set the visualization of the entries from an array in a table column. The user has the option to define how the UI separates multiple values from each other.
The options are line break (default), whitespace, comma, semicolon, or list based. With this new possibility, the visualization is improved and there is less whitespace in the Table widget.
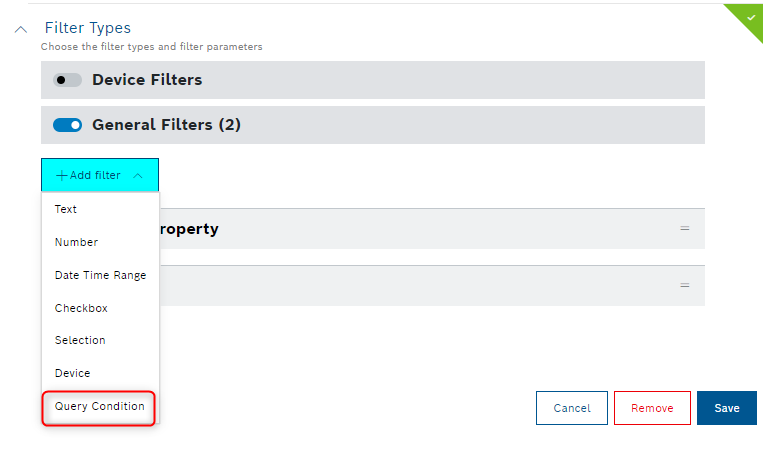
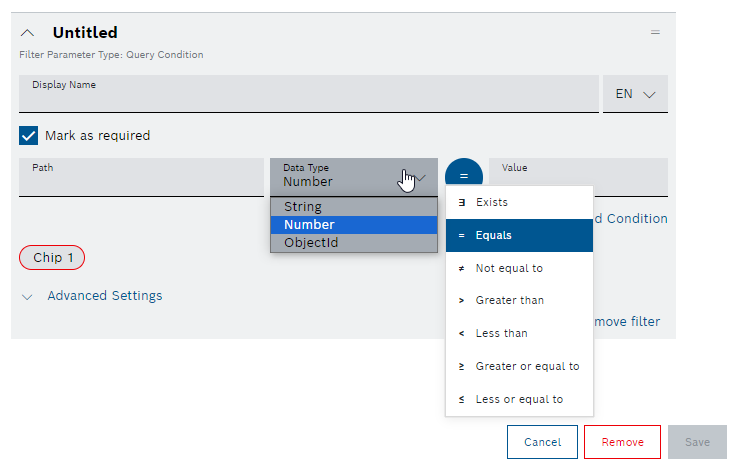
New filter type “Query Condition” for the Filter Panel widget
We made an improvement to the Filter Panel widget so that users can configure custom filter conditions with more freedom. We allow them to dynamically add new parameters or values to the filter definition. To create a query condition, the general filters in the filter panel settings need to be selected and the new "Query Condition" option chosen upon opening the "Add filter" menu. A clear description of this new option in the Filter Panel widget can be found in the documentation at Filter Panel widget: Using query conditions.
Further improvements:
- Action Button – the “Disable on specific condition” option is now also available if the action button is a link button.
- Calendar Widget – users don’t need to select a device in a booking anymore if there is only one device for a booking available. If there is only one device available, it will be automatically pre-selected.
- Signals Chart - If the user opens the “Select Signals”, the extra column name is not displayed anymore. Now the signal column will combine the name and the signal into one column. The reason for this improvement is that in some cases in the Signal column, a prefix was added to identify the signal.
Bug Fixes
In this release, we have addressed and fixed the following bugs:
- INS-5523: Calendar Widget - Booking details dialog is shown outside the viewable region
- INS-5395: Location Map should be resized back when showing a legend in a grid view
- INS-5643: Geolocation dialog is not displayed in full width
- INS-5518: Large whitespace at Rich Text Widget in combination with tab widget
- INS-5562: Line Chart | Down sampling settings | Zoom not working when activated
- INS-5669: Calendar widget doesn't load when you navigate to project styles
- INS-5524: Calendar Widget - Device Details are not shown when switching between projects
- INS-5504: Calendar Widget - TimeLine View scrolls away from "Today"
- INS-5632: Calendar Widget - device booking overlay not fully visible in grid layout
- INS-5758: Sorting error by tab widget creation
- INS-5312: Processing Pipeline - UI shows irritating status of crashed pipelines
- INS-5766: Prolongation Process: Old projects where no project admin exists should be considered
- INS-5739: Grid Layout - "Last update" hover over exceeds widget
- INS-5736: Session timeout dialog is not aligned correct
- INS-5676: Calendar - no e-mail notification sent also when "confirmation e-mail addresses" includes user(s)
August 29, 2023: New Feature Query Caching
We are releasing a new feature – Query Caching.
What is Query Caching?
Query Caching helps to store the results of long running queries for a defined time frame.
That means, you don’t need to execute these queries and load newer data every time. You can now easily access the data that resulted from another run of that same query especially if the most current results are not necessary. Also, if another user in your project runs a query, and others also want to view the content of that, they don’t need to execute that same query again which might save a lot of time depending on the amount of data.
Unlike the common cache approach, “our cache” is preserved over time. That means, if you change your mind in regards of the time frame or want to manually extract an old result, you can still do so.
So what exactly has changed?
Results of executed query templates are saved in the query history and can be accessed from there, too. Therefore, the Template Designer now provides a new option in the Advanced Settings. This option is enabled for all new query templates, by default, and stores the results in the cache.
For all already existing/older query templates this option was not enabled.
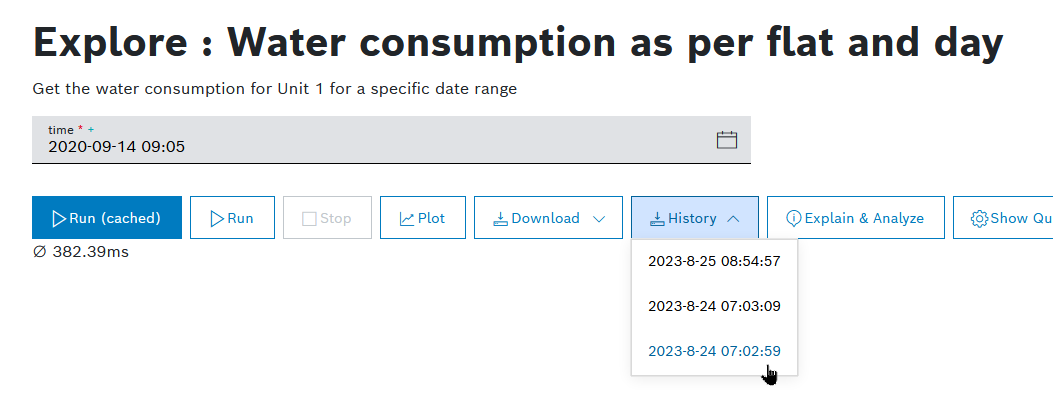
For running a query template with cache support, we also added a new button: Run (cached). By using this new button, you can make use of the cached results. The service logic will automatically fetch the matching entries for you. You can also select cached entries manually using the selection box History.
The cache is then, of course, also applied to all executions via API using the new header “X-cache_time” (see our Swagger API). This allows to individually define cache times via API call.
How does this effect the dashboard and widgets?
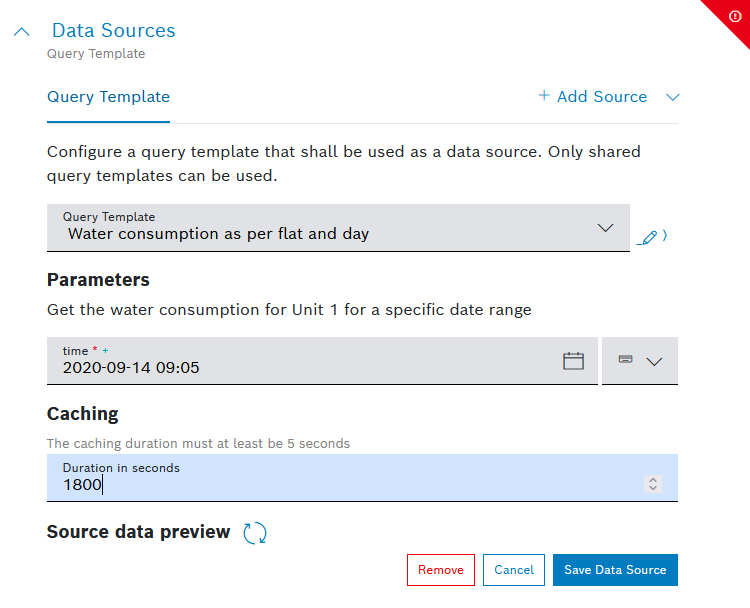
You can also configure a caching time for each new widget individually and independently from the settings of a query template. This can be done in the data source settings of each widget. For all new widgets, the default cache time of 30 minutes will be set automatically. Existing widgets have this set to 0, so that the cache is disabled and existing behavior is preserved.
The UI will use this setting to load existing cache entries that match your parameters. Also our cache logic is capable of handling relative time frames.
Workflow example:
1. User A loads a dashboard with content from the last hour. This creates a cache entry.
- Just 5 seconds later, user B opens the same dashboard to also load the last hour.
- User B will automatically get the previously cached result to directly see the content.
- The UI will trigger a background refresh, which will then update the dashboard later. So, the user can also get the most up-to-date data.
So what are the overall benefits of this?
- You can download old results whenever you want.
(The maximum for cached entries is 7 days in our object storage) - You can easily load all cached results from the new History drop-down list in the Template Runner, Query History, or via API.
- You can cache all your queries via API calls.
- You do not have to wait anymore for content to appear every time when you open a dashboard. The previous state will directly be loaded from cache.
- You can define your own caching times for each query template and widget to achieve the optimal scenario of your use case.
August 16, 2023: New possibility to optimize the reprocessing in the processing pipeline and further improvements
API is accessible via OAuth token from Azure AD
It is now possible for a user to log in to Azure Active Directory and use the Azure-provided OAuth token to use the Bosch IoT Insights API. A user can use his personal account to trigger actions in the backend in his name instead of using a technical user. The workflow on how to use OAuth with Azure Active Directory is described in detail at Authentication options.
Improved booking search with more than one keyword
We now offer users the possibility to search for a booking using more than one keyword in the booking search. The benefit for users is that they can specify the search in more detail and get better search results. A more detailed description of how to search for bookings can be found at Filtering for bookings.
Individual data order using reprocessing via a processing pipeline
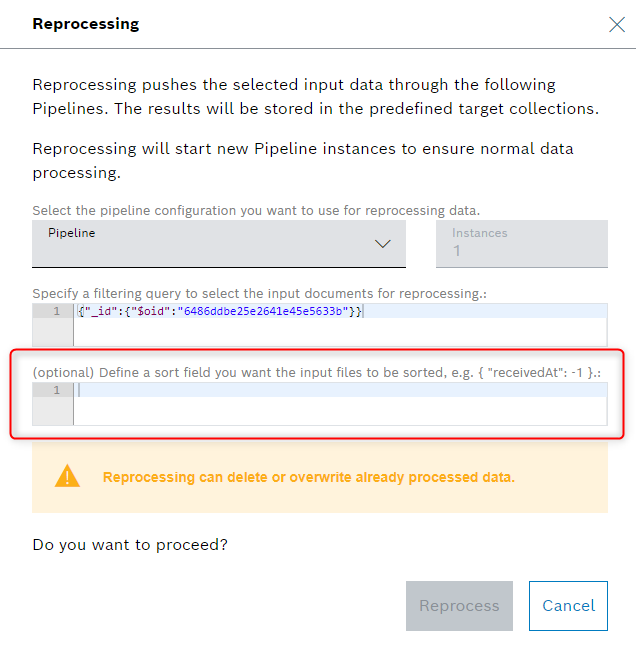
A user now has the possibility of specifying the order in which input files are reprocessed. With this improvement, we want to provide more freedom for reprocessing via a processing pipeline. A detailed description of reprocessing the input history can be found at Reprocessing the input history.
Pagination for the Calendar Widget
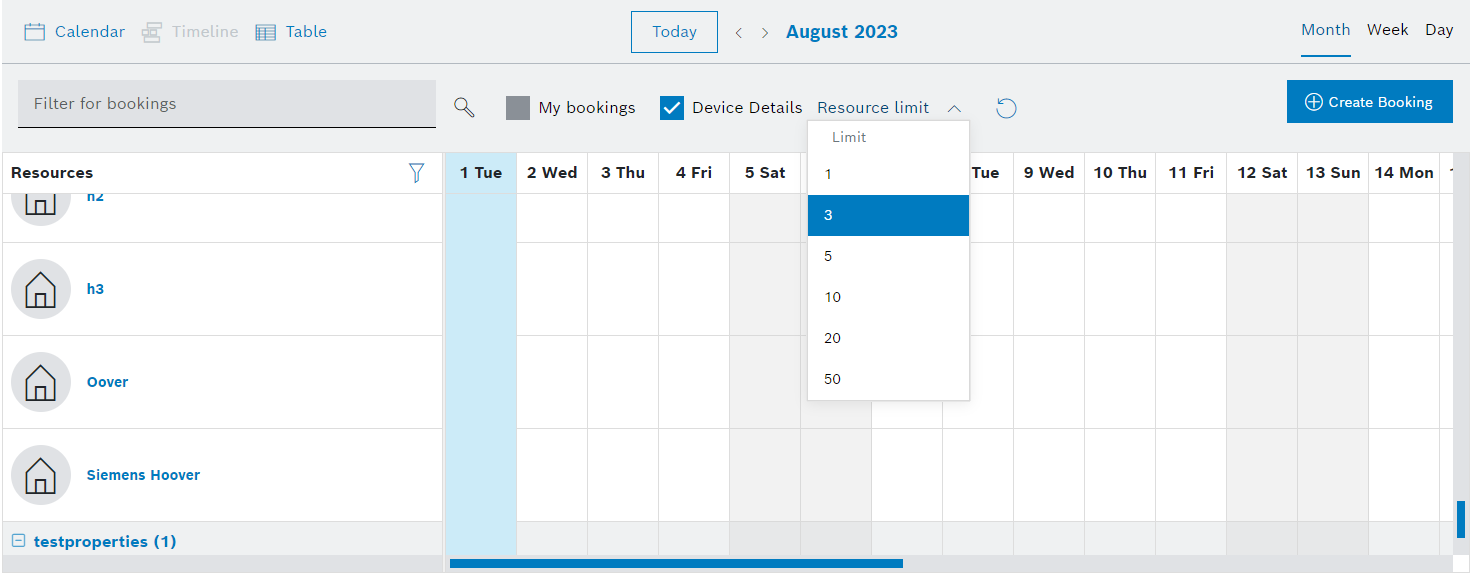
Users are now able to configure the number of rows that they would like to make visible in the timeline view. It results in optimal visualization of the calendar and leads to less white space. The number of rows will be reduced or increased according to the settings in the “resource limit”. So, if it is not desired that a calendar covers the whole page, this can now easily be customized.
Table column width is configurable
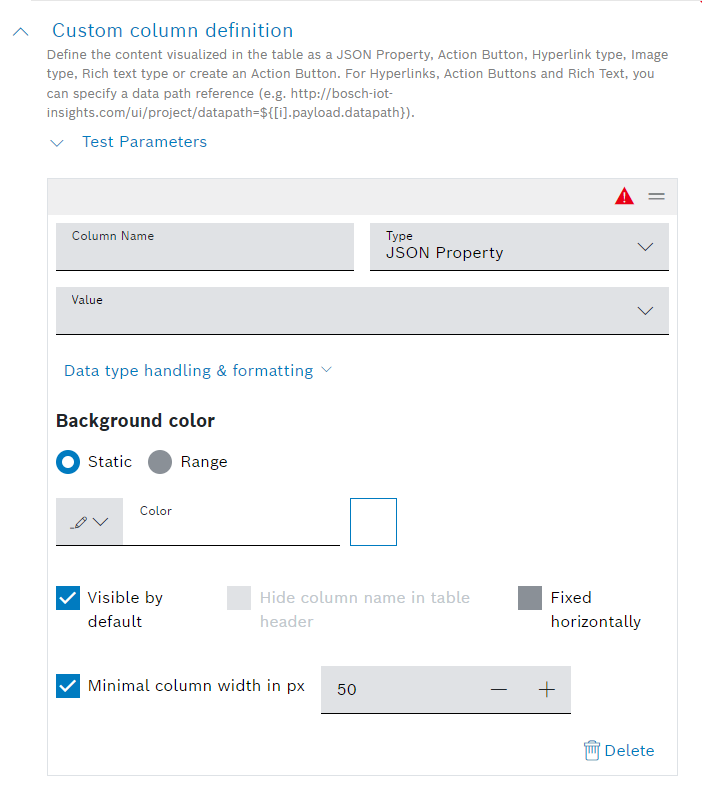
We now provide the option to configure the width of columns inside a Table widget. Via minimum column width, the look and feel of the table widget can be improved, and hyphenation (word breaks) in the column can be avoided. To set a column width, you can activate the “Minimal column width in px” checkbox manually, and then set the minimal column width.
Rich Text widget – new link type to “Copy link to clipboard”
The Rich Text widget now supports a new “Copy link to clipboard” option. This allows the underlying link to be copied when clicked, instead of navigating. It is now possible to choose whether a link in the Rich Text widget should open in the same tab, in a new tab, or whether the current URL should be copied to clipboard.
Calendar widget – changes and deletion notifications for bookings can be disabled
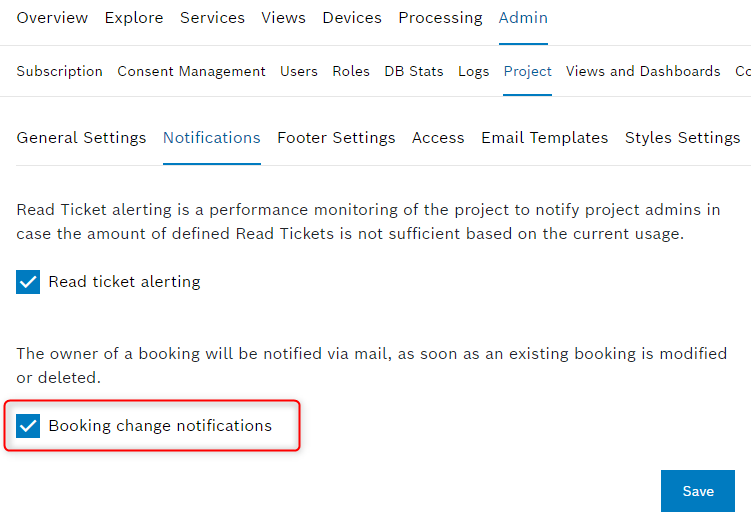
When changing or deleting an existing booking, usually an email notification is sent out to the user who created the booking. We implemented a checkbox in the Admin section under Project > Notification where you can now deactivate such notifications.
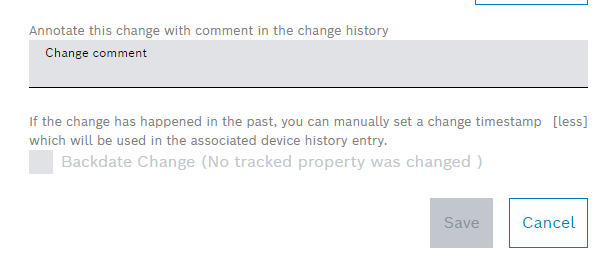
Device changes can now be directly commented on or labeled
Every change to a device can now be labeled or commented on directly with the change. So you don’t need to search for the corresponding entry in the device history before adding a comment or a label.
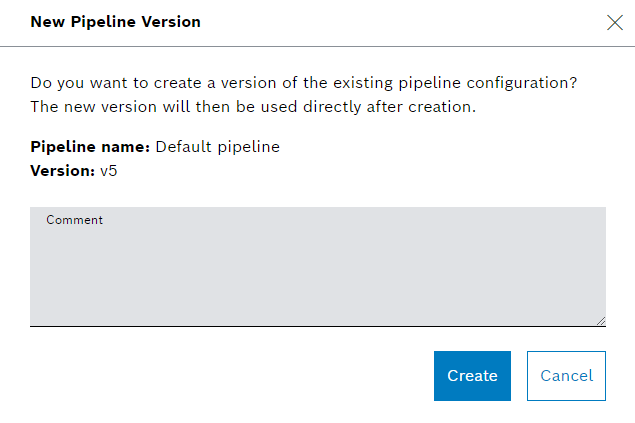
Processing pipelines can now be annotated with notes and comments
We now offer the possibility to add comments or notes to each pipeline version to provide additional information about the purpose and changes of a pipeline.
Further improvements:
- Device Management – More consistency in the description for Device Feature Blocks and properties.
Now the description is shown directly in the Device List View, Device Details View, and Device Details Widget. - Switch to Let’s Encrypt and automatic renewal of SSL certification – for all domains – from August 2023.
- For signal charts you now have the option to add a filling for line shapes.
Bug Fixes
In this release, we have addressed and fixed the following bugs:
- INS-5563: Widget should be editable even when having long titles
- INS-5283: The Bosch employee user migration seems not to work anymore
- INS-5470: Custom Pipeline Artifacts cannot be deleted even though they are not referenced or used
- INS-5424: Tab Widget header missing
- INS-5379: Table Widget Colors of cells are visible between rows of fixed columns
- INS-5442: Plot Widget – Two scroll bars appear when expanding signal selection
- INS-5338: Filter Widget – parameter gets overwritten by value stored in local storage
- INS-5241: Select All does not work with Load More
- INS-5648: Grid layout – High CPU usage on some dashboards
- INS-5502: Grid Layout – Tab widget making a line break by hovering
- INS-5618: Device Details Widget – Image is displayed very small
- INS-5503: Calendar – Device attributes in booking dialogue only displayed for the first time
- INS-5163: Explain & Analyze section shows incorrect values and is partly misleading
- INS-5564: Decoder name – can contain unsanitized HTML tags
July
July 06, 2023: User Management and Query Performance improvements
User Management
We identified some time ago a performance bottleneck in the user management system (Keycloak). Projects with many users and roles saw a significant slowdown when loading the list of users. Our colleagues implemented a performance optimization. The change has been deployed on July 4th, 2023.
This results for some projects in 10x faster responses when requesting the user list in a projects admin area.
Query Service
Queries that return many results are now faster. We introduced an adaptive batch size algorithm, which reduces the roundtrips between the database and the query service.
This resulted in test queries that return 50k documents in 3x faster download times.
Session cache fix
We identified a cleanup issue in our session caching solution. After a cleanup the API response times have been reduced by about 50ms.
June
Jun 19, 2023: New option to rearrange Tab widget and other improvements
Drag-and-drop for Tab Widget using the new Grid Layout
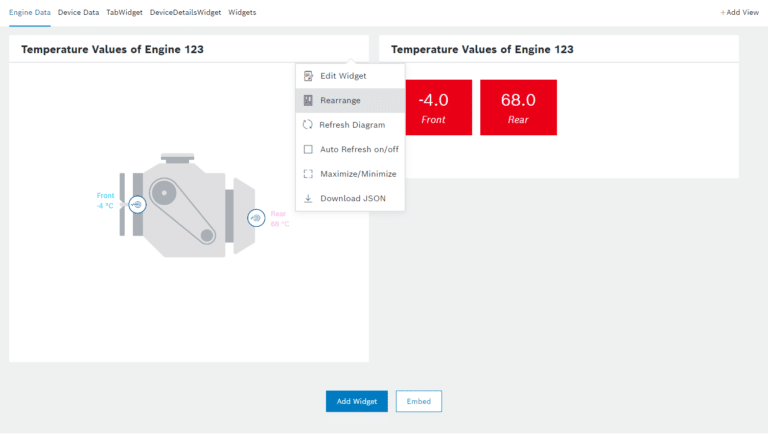
With the addition of the rearrange option users now have the ability to easily reposition tabs within the widget, providing more personalized and efficient workspace.
With a simple drag-and-drop functionality, users can effortlessly reposition tabs within the widget, allowing them to prioritize frequently accessed tabs or group related tabs together.
You can align the tab layout according to your project’s preferences and instantly rearrange tabs: click the tab to be moved, then drag-and-drop it on the new position.
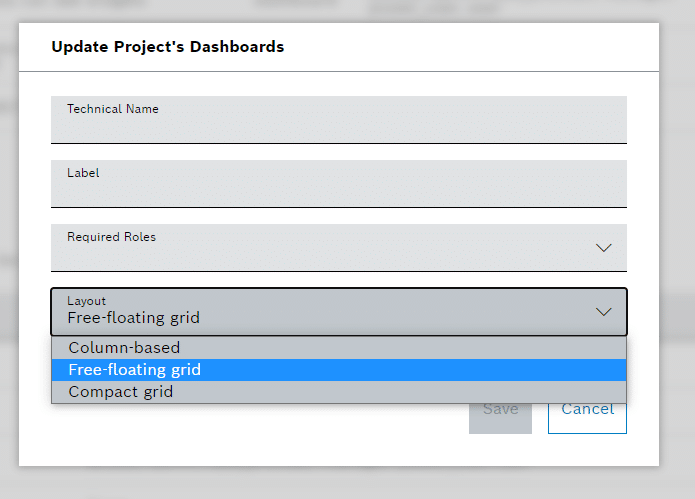
Grid Layout: New structure options – Compact and Free-floating
Users are now able to choose between two grid widget structures: Compact (default) and Free-Floating. This provides greater flexibility in organizing and displaying widgets to suit individual preferences and workflow needs.
The Compact grid structure provides a compact arrangement of widgets, optimizing space while displaying information efficiently.
This layout is ideal for users who prefer a streamlined and organized view. With the free-floating grid users have the option to customize placement and arrangement of widgets, which enables greater freedom in positioning widgets on the screen, and allows a more personalized and dynamic workspace.
Show duration and remaining of reprocessing time including optimization recommendations for processing pipelines
The reprocessing jobs overview now shows an estimated end time for running reprocessing jobs based on the documents that have already been processed.
Since long-running jobs have a higher risk of being interrupted, a warning and recommendation to increase the instances for a running job is displayed if the estimated duration is longer than one hour.
Notification/Alerting for denied requests due to reached read ticket limits
With this update, users will now receive a helpful hint when their requests are denied due to reaching the read ticket limits.
Key Features:
- Query History Overview: Users will notice a new warning indicator in the query history overview when their read ticket limits have been reached. This visual cue will help them quickly identify the cause of the denied requests.
- Admin Notification: Project administrators will now be notified via email when read ticket limits are reached by any user in their project. This allows admins to stay informed and take necessary actions to address the situation.
- Notification Control: To provide flexibility and customization, project admin now have the ability to enable or disable email alerts for read ticket limit notifications. This feature allows them to manage notifications according to their project’s requirements and preferences.
Log Retention Time is now supported by the Retention Time Management
We provide now the users the option to customize the log retention time.
This allows you a greater control over how long the logs are retained and allows to log retention with your specific needs and compliance requirements.
Further Improvements
- Time series collection handling – shows now a proper error when the time field is missing
- The device history information is now loaded by the UI via the MongoDB query history.
Bug fixes
In this release, we have addressed and fixed the following bugs:
- INS-4751: Map Widget: Colored tour shows no longer an error if all points have the same coordinates
- INS-4760: Tree view in Data Browser can wrap now long lines
- INS-5102: Role changes are now logged in the Audit Log
- INS-5383: Explain “returned number of documents” shows now the correct value
- INS-5213: Data Browser does not show infinity when end of results has been reached
- INS-5294: Data upload with device-IDs and metaData works reliably again
- INS-5337: Properties of undefined deviceType symbol can be read again
- INS-5282: Booking details dialog is displayed again within the screen
- INS-5322: JMES path input in table widget works correctly again
- INS-5340: Icons in the booking area of the devices haven bee adjusted for many entries
- INS-5345: Device Management – Issue visualization device details for some devices
- INS-5382: Multivalue attributes filter works now
- INS-5029: Data Explorer: Parameter in URL are now used in the UI
- INS-4882: Template Designer > Advanced Settings: Read Ticket timeout display now correctly
- INS-5393: Security Finding for Gson 2.8.1 is fixed
- INS-5403: Data Analyzer: The run button is no longer disabled if all input fields contain valid values
- INS-5444: Updating the query template design works again, even if the label is null.
- INS-5414: User is asked to login again after browser is closed
- INS-5284: Inconsistency between binary and multipart data upload for device attachments are fixed
- INS-5115: Query History action buttons use now correct API endpoint
- INS-5271: Filter Widget select all button is now visible for only filters which allows a multiselection
- INS-5297: Data Upload metadata validation combined with mandatory devices works again
- INS-5526: Gateway OAuthServiceIT integration test works now with SingleKey ID
- INS-5350: Table-Widget: zero iterator gives not a different result anymore
- INS-5431: Card edit icon is no longer large
- INS-5439: Table Widget: Error when opening filter tooltip is fixed
- INS-5484: Grid Layout > Playback Widget: Missing Edit options are added
- INS-5499: Playback Widget contains Widget-Container and Context Menu Options
May
May 25, 2023: New style for dialogs and further improvements
New style for dialogs
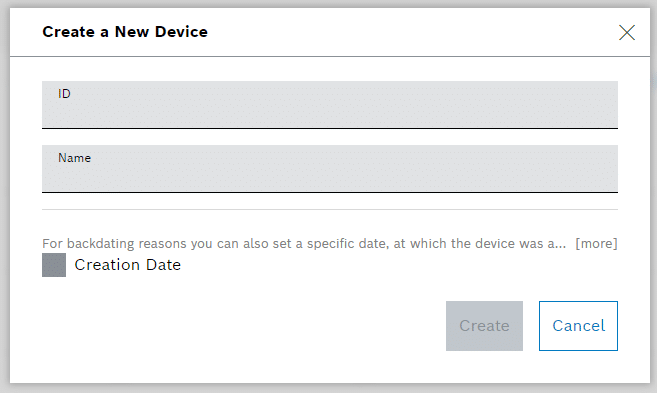
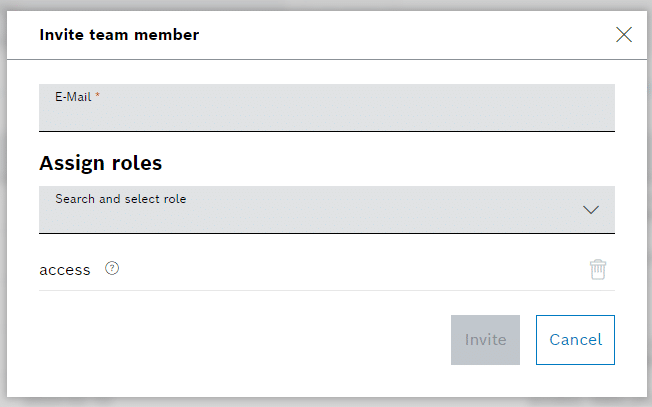
We have made some updates to the style of our dialogs.We have applied the new style to all dialogs in our service, such as when adding users or devices, creating a collection, and in many other places.
Billing for E-Mails and SMS
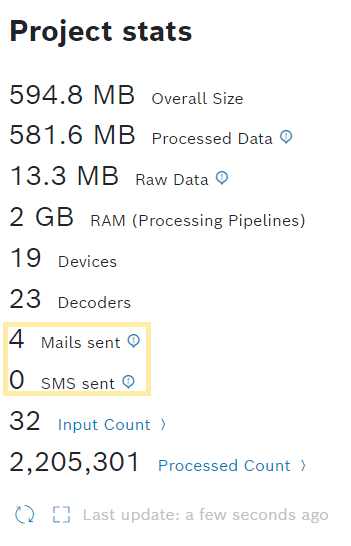
All mails and SMS messages sent by a project will be charged to provide better and more reliable services to our users. In addition, we have added a new feature that displays the amount of SMS and mails per month in the Project Stats Widget. This will help user manage their costs more effectively and provide greater transparency.
Disable button or link in Table and Action Button widgets
More possibilities have been added to the rest request option in the table widget and in the action button widget. The user might enter a placeholder containing the https-protocol and select a condition to disable the button or link.
Configurable device details in calendar timeline view
We have made an improvement to our Calendar Timeline view. Users can now configure the device details displayed in the timeline view. By default, the timeline view displays device details which the admin has defined before. With this update, users can now choose to show or hide specific device details according to their preferences. This will allow users to better tailor the timeline view to their needs and make it easier to manage their devices.
Free Plans device limitation
Since our Free Plans only allow up to 10 devices, we now show a proper recommendation dialog if the limit is reached.
Bug fixes
In this release, we have addressed and fixed the following bugs:
- INS-4928 – Using Calendar widget inside a tab widget it no longer throws an error message
- INS-5051 – The input label area are now clickable again
- INS-5105 – The Action Button widget is now definable through a placeholder
- INS-5267 – The displaying of the popover filter is fixed
- INS-5280 – After widgets are loaded the view now stay at the top of the page
- INS-5029 – When using a URL with parameters in Data Explorer, the corresponding parameters are now set in the UI
- INS-4790 – Rolling Restart of Kubernetes works now as expected
- INS-5203 – Parsing Things-IDs by our standard parser works now
- INS-5260 – Device image feature does show now images correctly after replacing an image
May 25, 2023: Processed Data Retention Times and more
Retention Time Management now includes Processed Data collections
In the past, we already introduced the retention time management for other collection types.
Now, you can also set the retention time for Processed Data collections, including a customizable time property path.
For further information see https://bosch-iot-insights.com/static-contents/docu/html/Retention.html
Action Button widget with better handling for missing data source
The Action Button Widget will now show a disabled state when the data source returned an error e.g. because the data could not be retrieved.
This way the user will not get confused, why a button does not provide any reaction
Auto-completion for calendar booking confirmation E-Mails
The calendar booking creation dialog (confirmation E-Mails) now support auto completion.
When you start typing you will see the filtered suggestions based on your input.
The results shown are limited to 10 entries to reduce an graphical overload.
Dragging of Calendar widget bookings
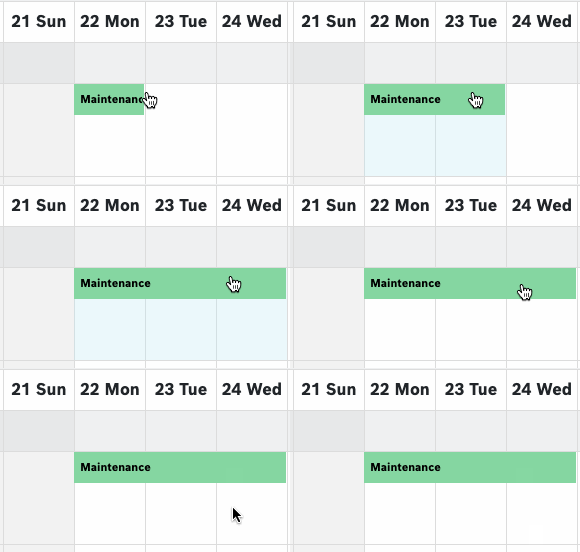
It is now possible to increase or decrease booking durations via drag an drop.
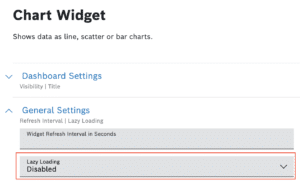
New lazy loading option for widgets
Widgets now have the option to be Lazy loaded.
When lazy loading is enabled, the widget will only start loading when it gets visible on screen.
Using this can increase performance and reduce the amount of read tickets required for a dashboard. Especially for dashboard with many widgets this can be a useful option.
The option for enabling and disabling lazy loading has been added in the widget configuration under “General Settings”.
By default all the newly created widgets will have the option enabled. Existing widgets will be unaffected to sustain backward compatibility.
Free plans user limitation
Since our Free Plans only allow up to 10 users, we now show a proper warning dialog if the limit has been reached.
To prevent confusion on user side, why no more users can be added to the subscription.
Bug Fixes
- INS-4556 – The pagination in the Processing Information View should show the correct amount of pages
- INS-5011 – Dynamic Device attributes should be correctly editable
- INS-5045 – The Collection Selector should show the correct hint when an internal collection is selected
- INS-5114 – Changed timezone should also be set even when refreshing the browser
- INS-5117 – In the Device Overview, linked Devices should now correctly show up, even when no filter is set
- INS-5152 – Signal chart should handle empty data points correctly
- INS-5176 – Calendar widget should correctly pre-select the correct date when in summer time
- INS-5215 – Filter Widget should correctly clip longer text input values
- INS-5247 – Java Processes should correctly receive additional memory when configured by users
April
April 25, 2023: Bosch IoT Insights – New Grid Layout Manager and MongoDB Upgrade to 6.0
Introducing a new Layout Manager for Dashboards – Grid Layout
We are happy to announce the introduction of a new layout option for dashboards for you.
This new Layout manager allows free placement and rearrangement of widgets.
In order to use it, you have to create a new dashboard and set the Layout type to Grid
or you can also convert an existing dashboard to Grid by updating the configuration in the Admin Section.
Keep in mind that you can’t convert it back to Column Based once Grid layout is applied.
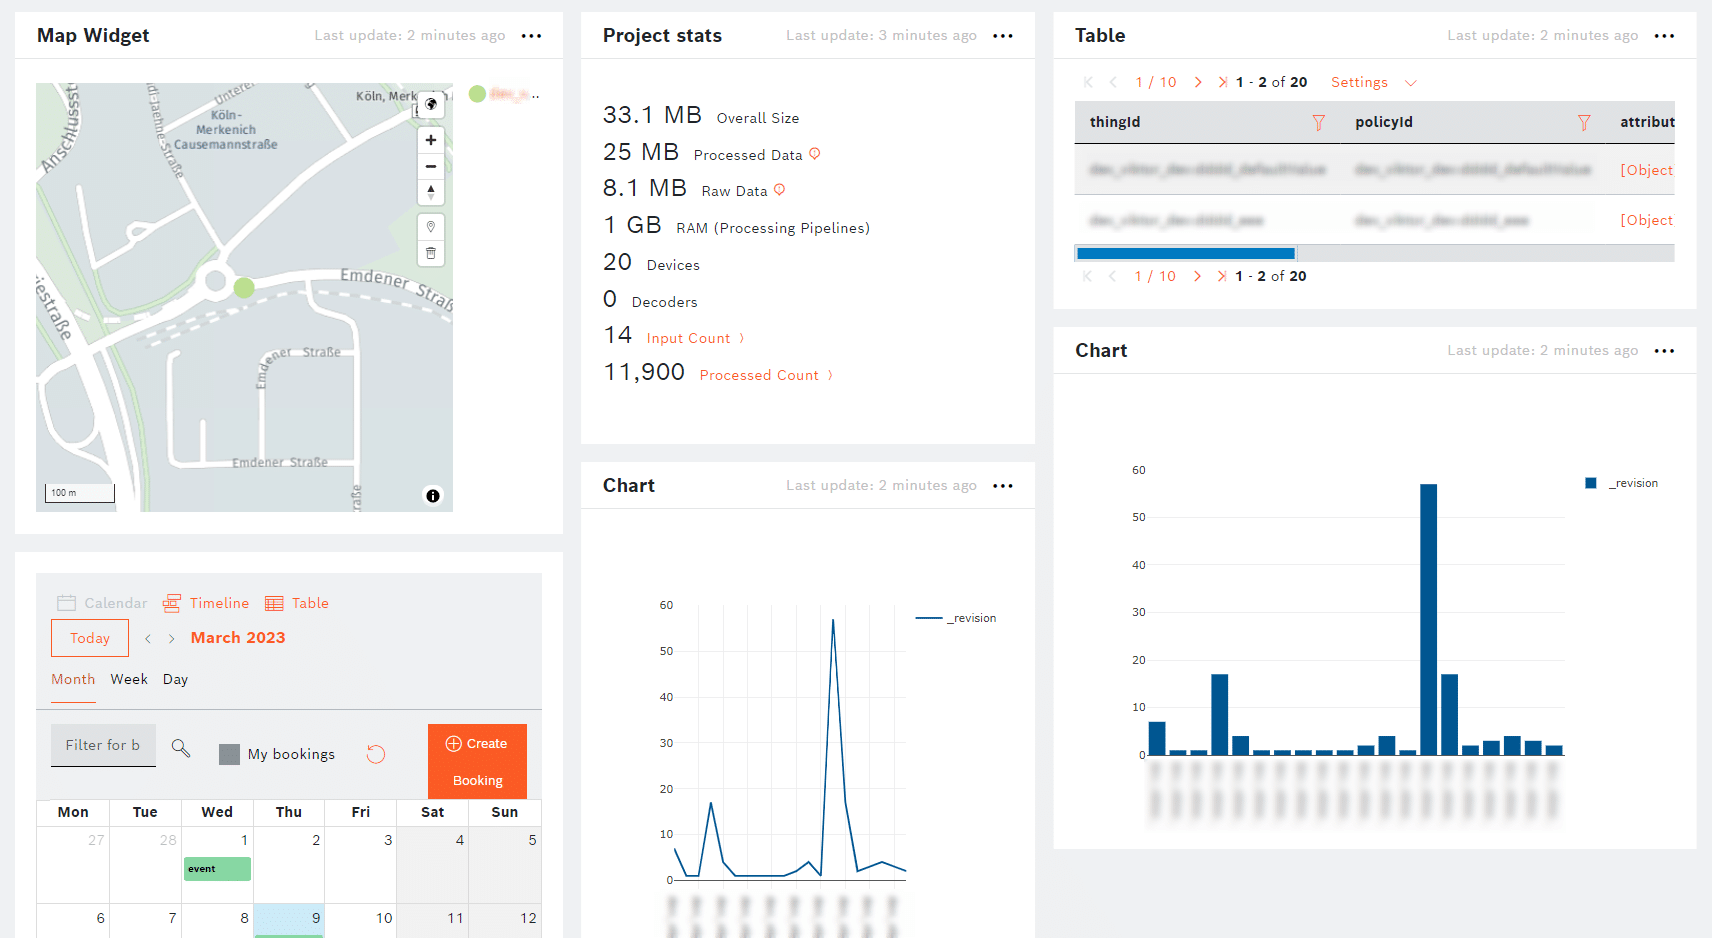
Example of a dashboard with the new Grid Layout.
To rearrange or change the size of the existing widgets, the button “Start Sorting” can be used. You can resize or use drag-and-drop to change the positions. When you are ready, “Finish Sorting” will apply your changes.
MongoDB upgrade to 6.0.x
We have upgraded all MongoDB replicasets of our service to the version 6.0.x.
This update includes new aggregation commands as detailed in the release notes here.
We also recommend upgrading processing pipelines with custom code to the new driver version to fully utilize new features.
Further information you can find here.
Average execution time of Query Templates
We now show the average execution time of query templates inside the data explorer, to provide users a indication about their usage and average timing.
This also includes a info message in case of query templates that are executed longer then 5sec, since those usually cause a UX problem for most usecases.
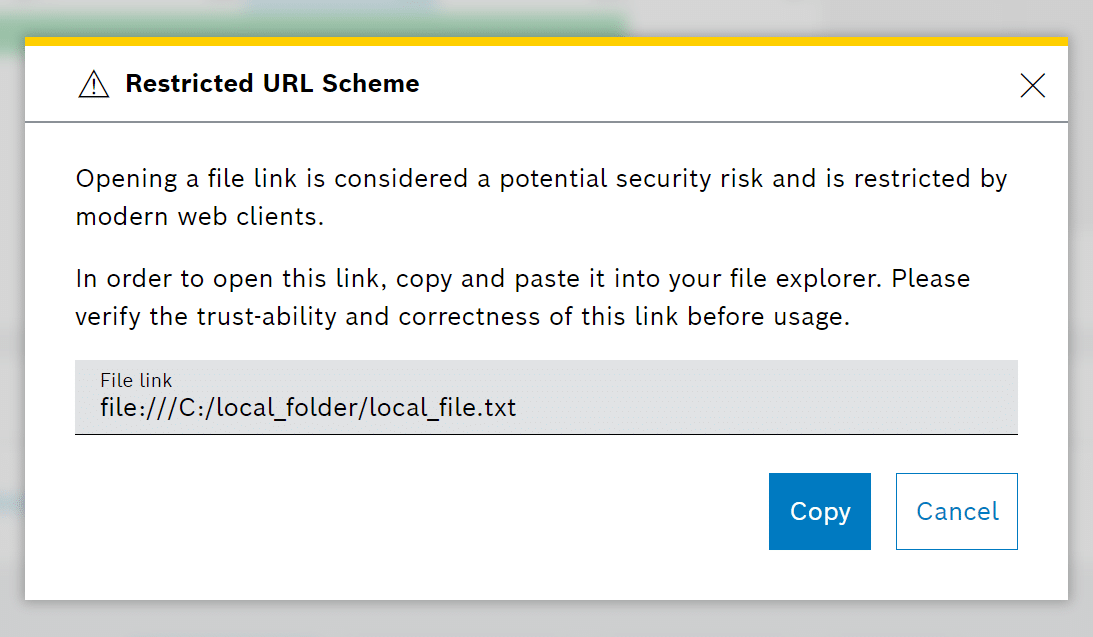
User-friendly file link support
File links are now supported on all places where a hyperlink can be inserted (e.g. . Richtext Widget, Table Widget, Link Panel Widget, etc..).
When a file link is clicked, a info dialog is shown with some helper explanation.
The user can then copy the link from the dialog through the “Copy” button.
This is introduces since all modern web browsers do not allow the direct usage of local file links due to security reason.
Calendar widget improvements
We made several improvements to the calendar widget:
Outlook calendar entries are now marked as “free” after accepting.
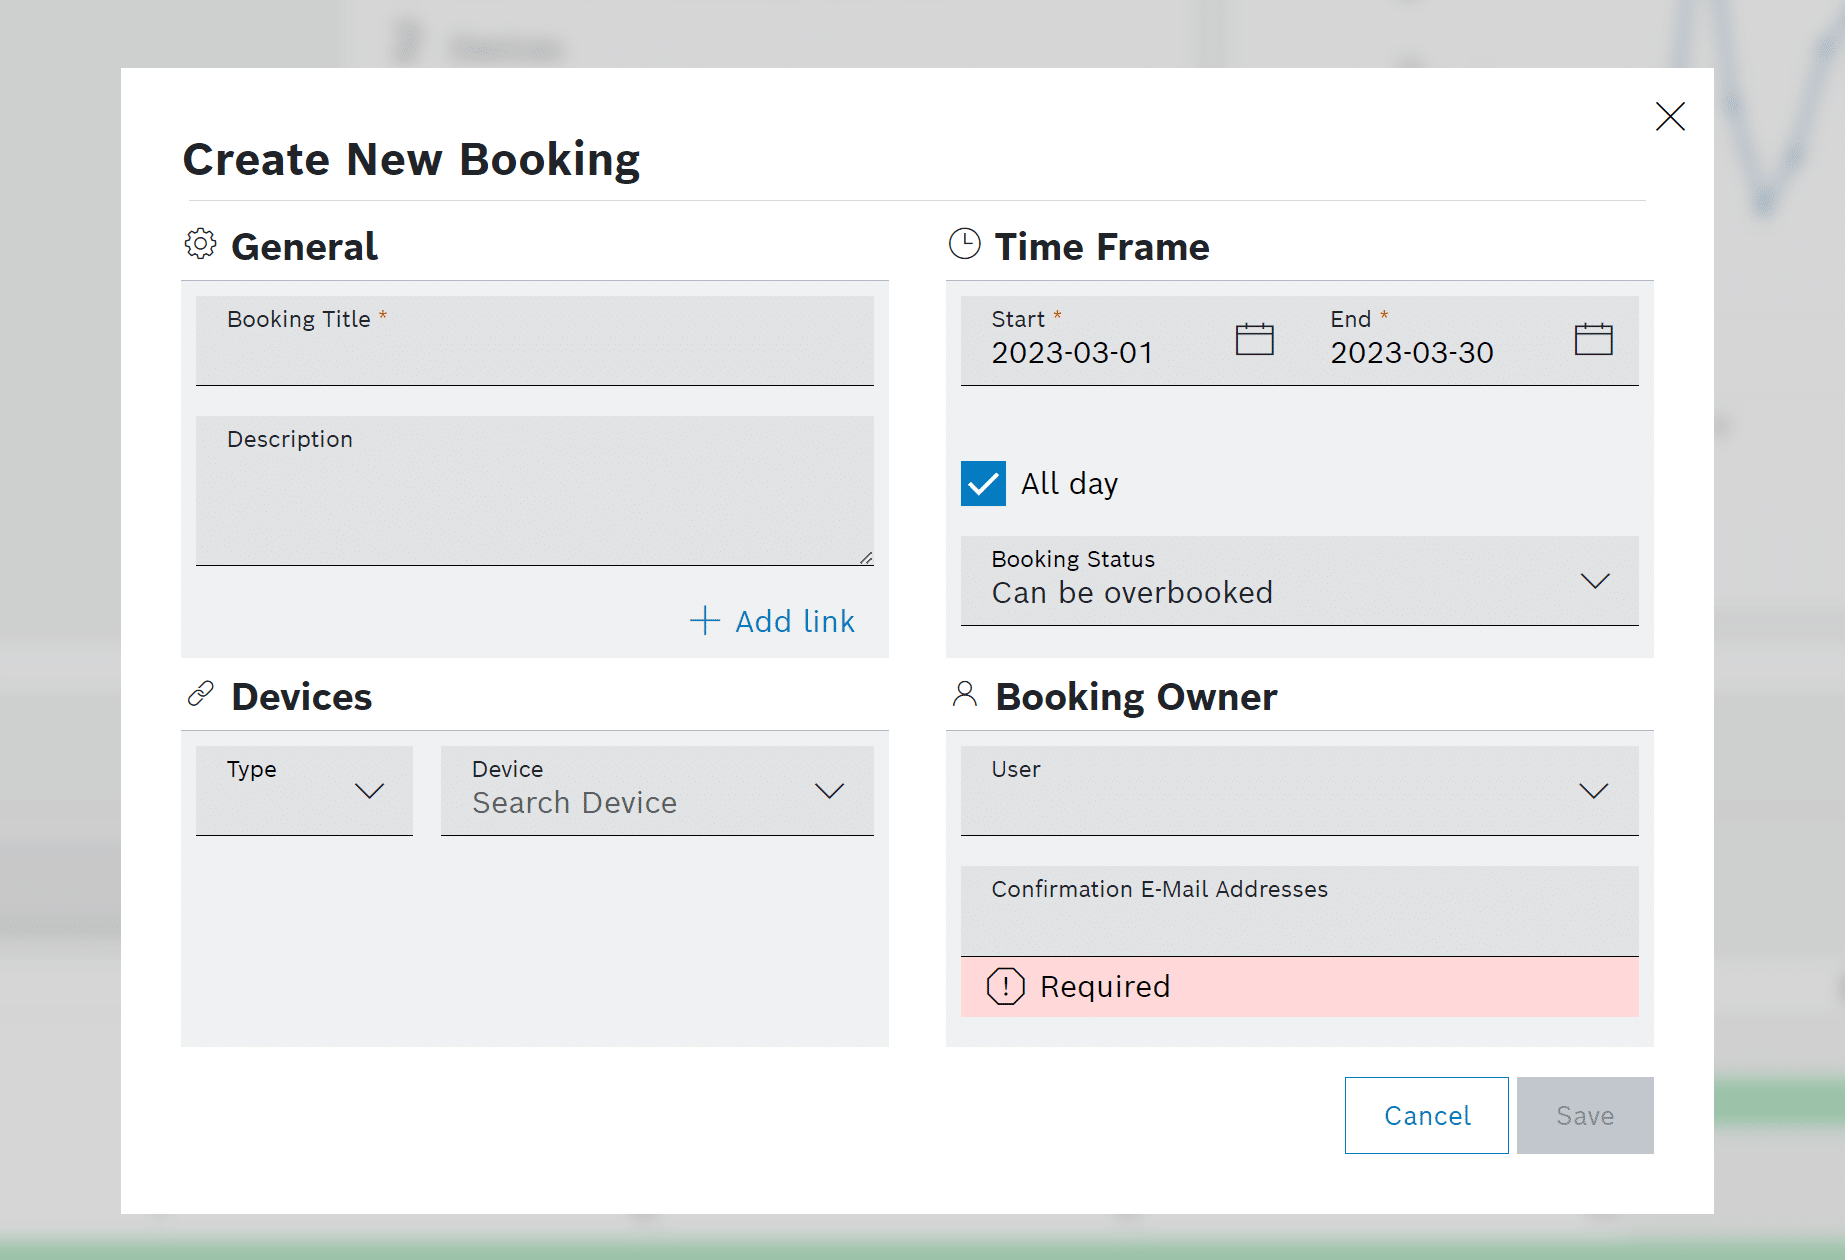
The booking dialogue now has a two-column layout to reduce the vertical space it takes up and displays the device details if they are available.
In addition, the size of the calendar header was reduced.
Further improvements
- Upgrade guava from 27.1-jre to 31.1-jre
- Rich text widgets now support the output of arrays by putting each entry in a separate line
- Device history data model improvement:
multi-value properties are now stored as arrays; label definitions are not stored as they belong to the device type, not the device property
Bug fixes
In this release, we have addressed and fixed the following bugs:
- INS-5162 – Geofence feature was not enabled for all paid plans
- INS-5193 – Misconfiguration of the Object Store Container postfix cause processing error
- INS-4990 – MDF out of memory error – Memory consumption improvement
- INS-5170 – Data sources and rest buttons send access tokens to 3rd party services
- INS-5176 – Calendar widget doesn’t preselect the correct date in summer time
- INS-5054 – Show a hint when internal collection is selected, but not based on the category
- INS-5011 – Dynamic attributes – data visualization during editing is corrupt
April 12, 2023: Bosch IoT Insights – New Service Update – “Explain & Analyse” Feature for Query Templates, Performance and Memory Hints in Processing Pipeline
“Explain & Analyse” feature for Query Templates & Data Analyzer
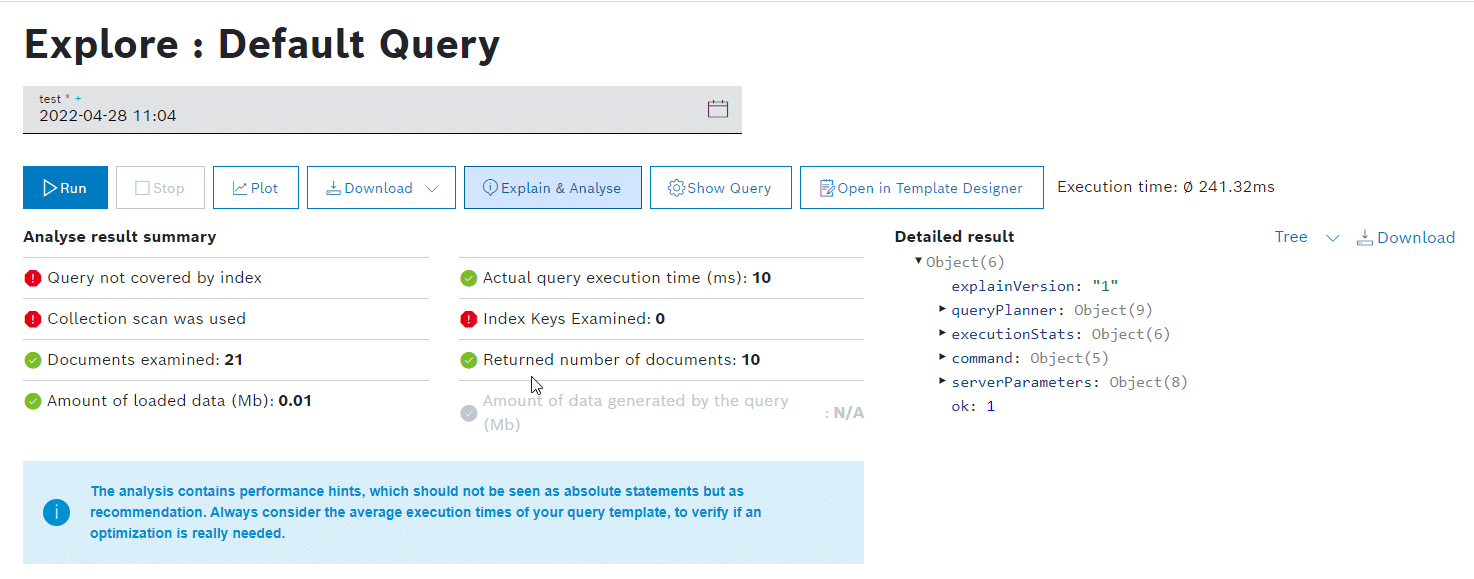
Explain & Analyze functionality is now available for Query Template, Data Analyzer and Query History screens. The goal of this feature is to provide good indications to the users how to optimize and improve their queries.
The function to analyze a query is provided by MongoDB, but we are transforming the result and displaying it in a user friendly manner. Still you can see the original response in details on the right side of the screen.
Each of the summary items displayed as a result of the Explain & Analyze request have a detailed information when you hover over their status icon.
Performances and memory hints in processing pipeline
We have improved the display of the percentage CPU utilization within the processing pipelines. This now actually gives users realistic values for the guaranteed CPU performance of a pipeline. With this, we can now see that some customer pipelines have a contested load (100%). To make this obvious, a warning message now appears when the CPU usage or memory usage is increased and how this can be avoided.
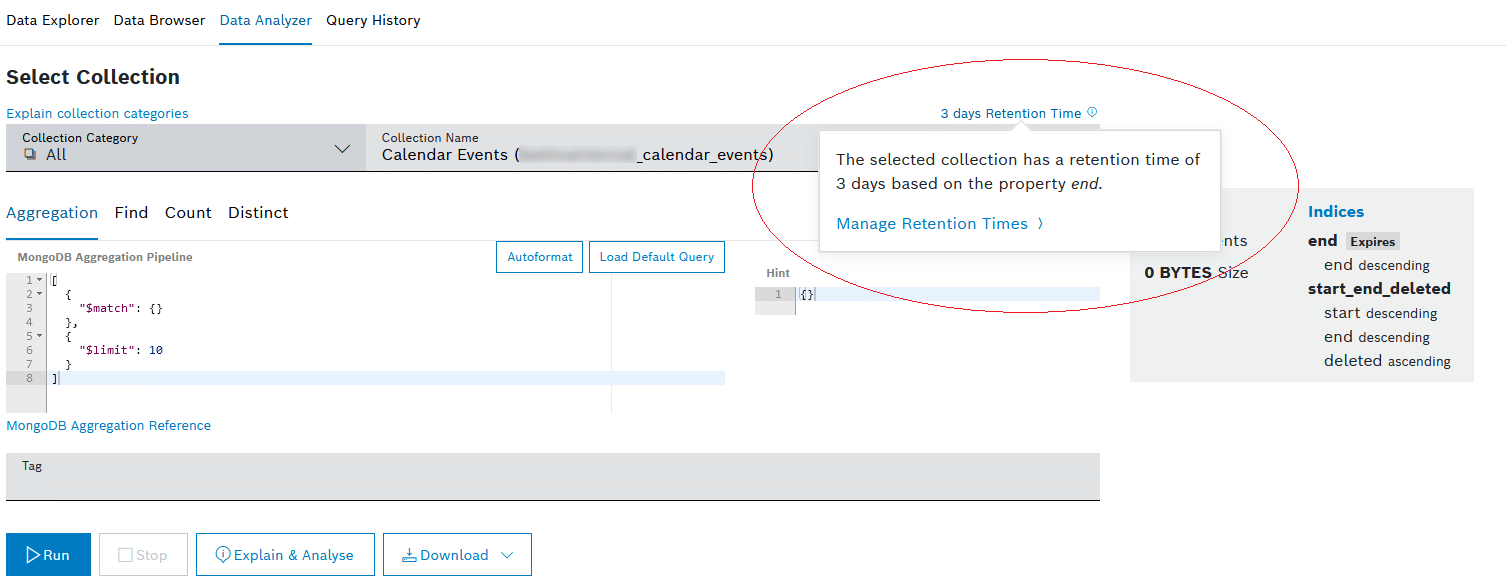
Retention time is visible in Data Browser, Data Analyzer, and Query Templates
When users select a collection in the Data Browser, Data Analyzer or when creating a new query template and a specific retention time is set for this selection, this is now shown to the user via a small hint in the collection selector. Clicking on the hint further shows the property on which the retention time is based as well as a link to the retention time management.
Placeholders: new relative date modifier
Two new placeholder modifiers “relativeTimestamp” and “addTime” have been introduced. They allow the calculation of relative Timestamps according to a passed date value or time difference in milliseconds. Their usage works similarly to the already existing modifiers:
Example usage of “relativeTimestamp”
This modifier calculates the relative time as given by a resolved placeholder. If referring to a Date Filter Parameter provided by the Filter Widget, a possible usage could be ** ${filterParams.dateTime.from | relativeTimestamp }. ** Assuming that the placeholder would resolve to a negative numeric value, such as -300000 (5 Minutes in milliseconds), the modifier would calculate a timestamp subtracted by 5 Minutes and return an ISO Date String.
Example usage of “addTime”
This modifier requires an additionally passed parameter representing the desired time offset to be subtracted or added to the resolved date time.
Analogue, if a five-minute subtraction should occur from the provided resolved placeholder value, the modifier could be used as ${ insights.timestamp | addTime: -300000 }.
Assuming the placeholder resolves to a valid ISO String, the number of milliseconds will be added or subtracted from the provided timestamp.
This modifier is designed for standalone usage in widgets, without the need to provide an external parameter, such as from the filter widget.
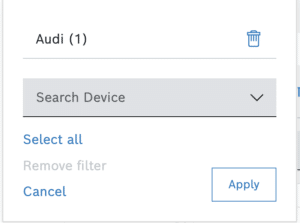
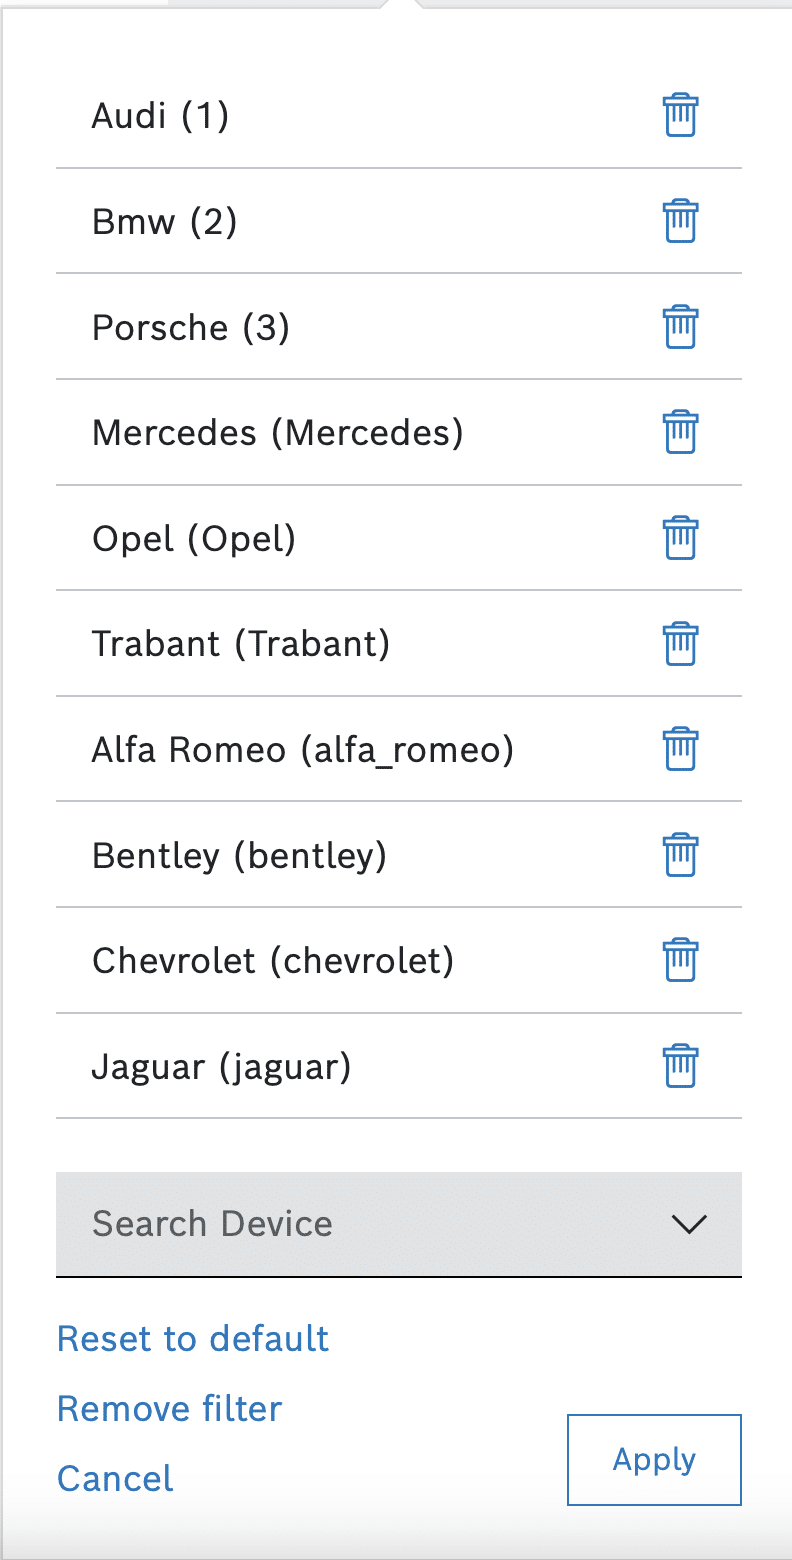
Possiblity to “Select all” in the Filter widget for multiple selection options
When the user selects all options, an indication will be shown that all options have been selected. This feature will be available for both devices and general multiple choices.
Selected all options:
Initial sort order for Table widget
The initial sort order feature allows users to easily define an initial sort order in the table widget itself. This will save time and effort, and also allow users to see the intended sort order in the UI, making it easier to work with the data.
Further improvements
- Widget UI Improvements
- Group resources by their device types in calendar widget
- Extend Data-Recorder API with HTTP header limit information
- Frontend based interpolation / point reduction of lines and points for chart widgets
Bug fixes
In this release, we have addressed and fixed the following bugs:
- INS-4884 – Query Error Reason not returned to user
- INS-4089 – Retention time not set in database when creating timeseries collection or updating it
- INS-4553 – File upload in Swagger UI shown as text input
- INS-4892 – GPX Tracks are not shown anymore in Map Widget
- INS-4779 – Processing Pipeline Frame throws Null if reprocessing is canceled or stopped
- INS-5000 – Removal of Pipeline does only remove the configuration
- INS-5042 – Reprocessing fails in case of network interruption
April 6, 2023: Update of Data Protection Notice
We would like to inform you about the update of the Data Protection Notice of Bosch IoT Suite, which becomes effective on April 6th, 2023.
The update concerns our new registration service and the new legal situation.
From April 6th, 2023 on, you can access our digital services through SingleKey ID.
Your existing Bosch ID credentials will be valid for login with SingleKey ID. There is nothing you have to do.
More information about SingleKey ID is available at https://singlekey-id.com/en/home/
March
March 7, 2023: Bosch IoT Insights – New Service Update – Device Access Rights for Input History, Retention Time extension, and more
Device access rights for Input History
This feature enables you to bind you uploads to devices and to restrict the download to the specific device permissions.
So, it is now possible to control which user can access which kind of uploaded content.
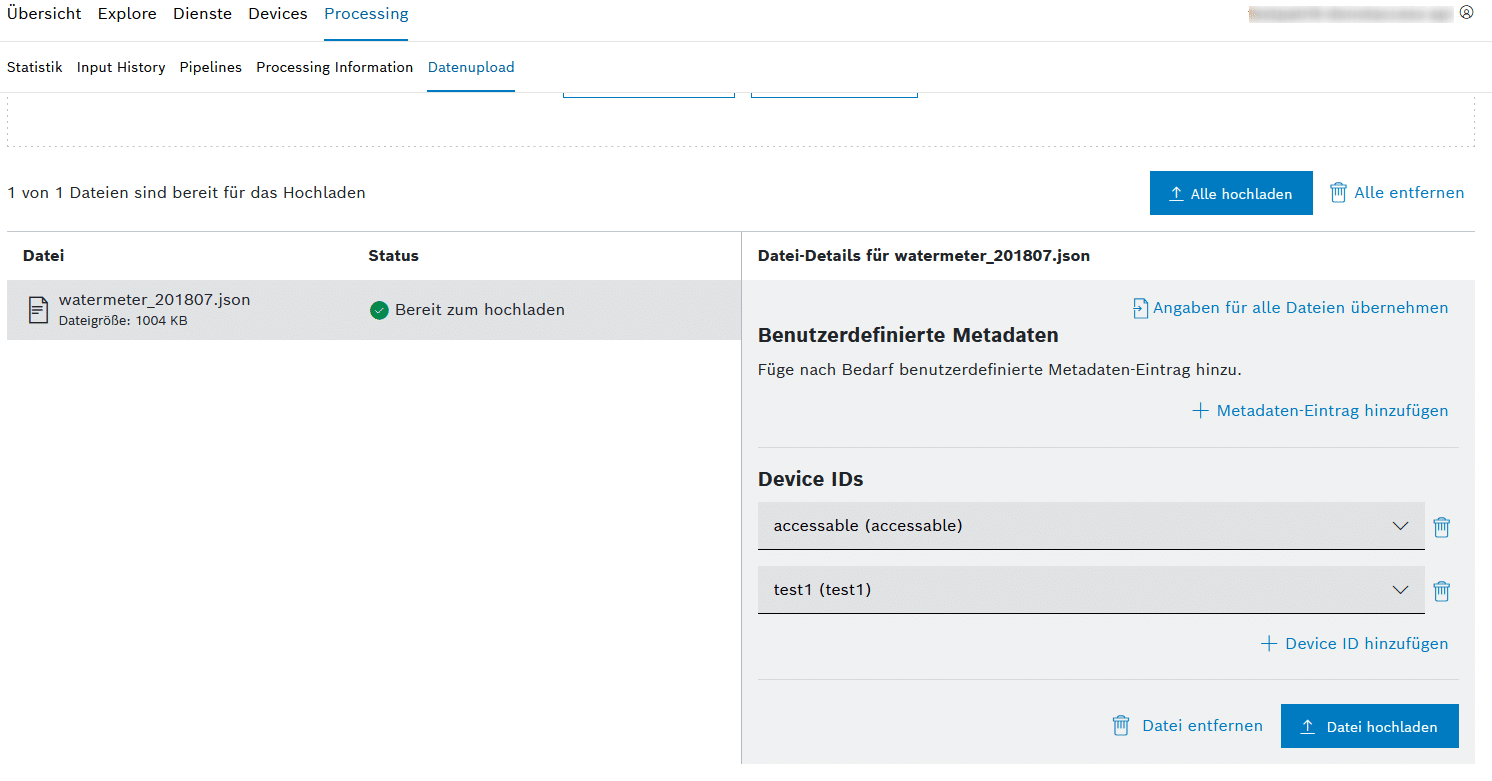
To use this feature, you need to add a “X-ThingId” header containing the appropriate device IDs to your uploads. In case of a manual upload inside of the Bosch IoT Insights UI you are now able to add devices to your upload as you can see in the screenshot.
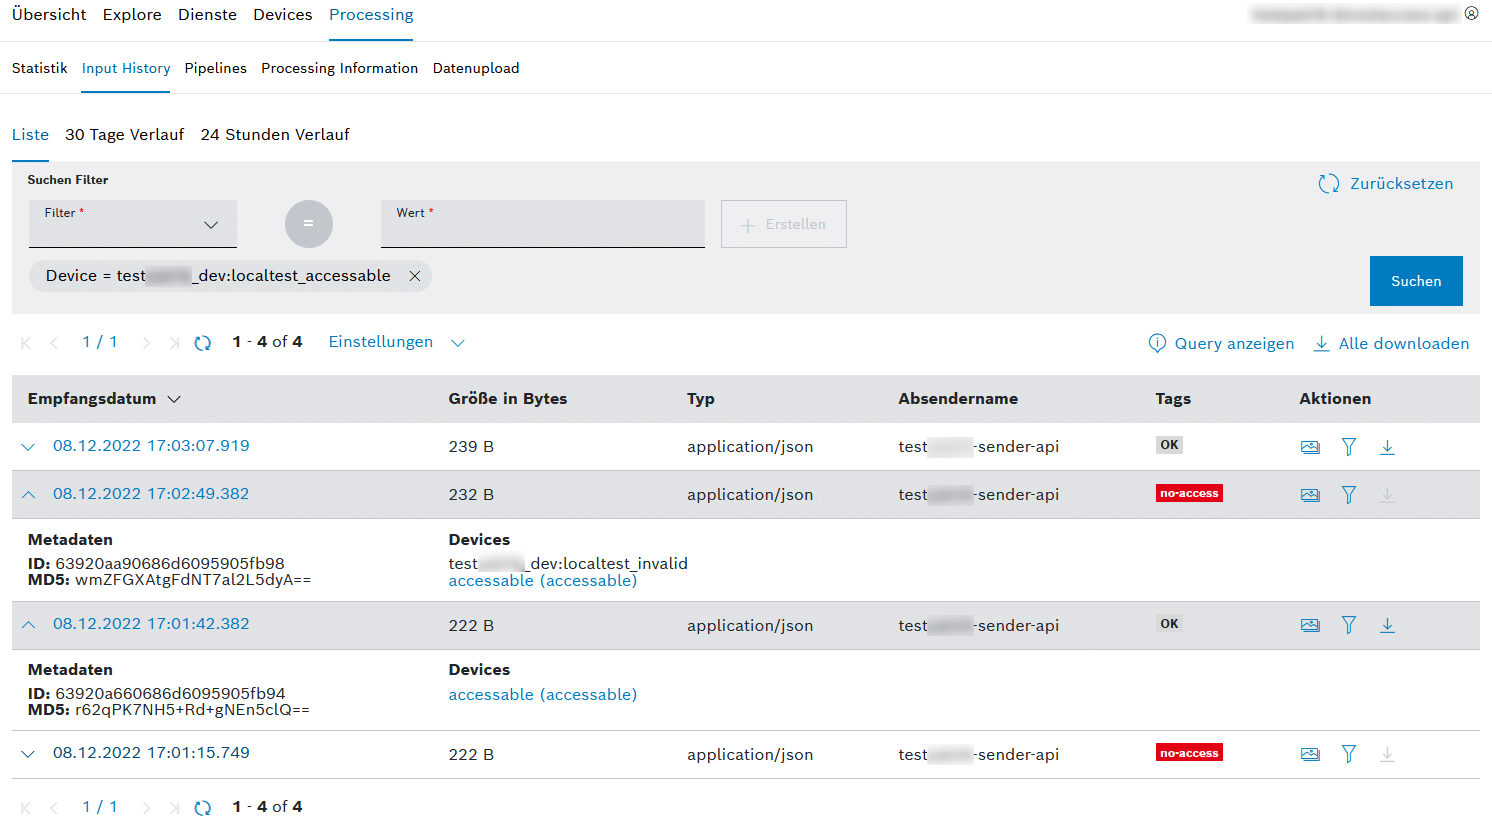
When using this feature, you can see which devices are bound to a specific upload inside the Input History,
by expanding the details or selecting the preview of an entry.
The following rules are applied in general:
- If no devices are bound to an upload, the user with access to Input History can download / preview the payload.
- If devices are bound to an upload and a user can access all bound devices, the user can also download / preview the payload.
- If devices are bound to an upload, but the user can not access all or some of the bound devices, the user will not be able download / preview the payload which is also signaled by the tag “no-access”.
- When using the “Download All” function, only payloads will be downloaded on which the user has access (all bound devices).
Furthermore, it is now possible to filter for bound devices.
Retention Time Management now includes Query History
In a previous release note we introduced Retention Time Management.
Now, you can also set the retention time for Query History entries.
As the project admin you can define it based on the creation time of the query request.
The default is 90 days.
Further options will be added in the next update.
Redis Service side caching optimization
We optimized our internal session handling, which improved the latency of all your client requests to our service by up to 70%.
Direct access to all internal collections
We extended the usability for query templates, so it is now possible to access also all internal collection directly via query templates and data browser.
This allows users to combine internal logs, history information, and other data for their use cases more freely.
To separate the different collections type, 3 collection types “Custom Collection”, “History & Logs” and “System internal” were introduced.
Placeholder support in widget titles
It is now possible to use placeholders inside of widget titles.
Depending on whether a filter widget or a widget data source exists, you can add the corresponding placeholder: e.g.
Widget ${filterParams.param}Widget ${[0].payload.value}
Update of icon library
The front-end icon library was updated to provide a more icons to all users.
Rework Admin/Users layout
The Management UI has been refactored to allow a better usability and focus on the most important functions.
Extended RAM and disk size for Pipeline Apps
As a result of the infrastructure migration to Microsoft Azure, you get higher infrastructure limits for processing pipelines:
- the limit for RAM per pipeline instance was increased from 8GB to 32GB.
- the limit for disk space per pipeline instance was increased from 4GB to 32GB.
In case of problems with this limit, or if a higher amount is needed, please contact our support.
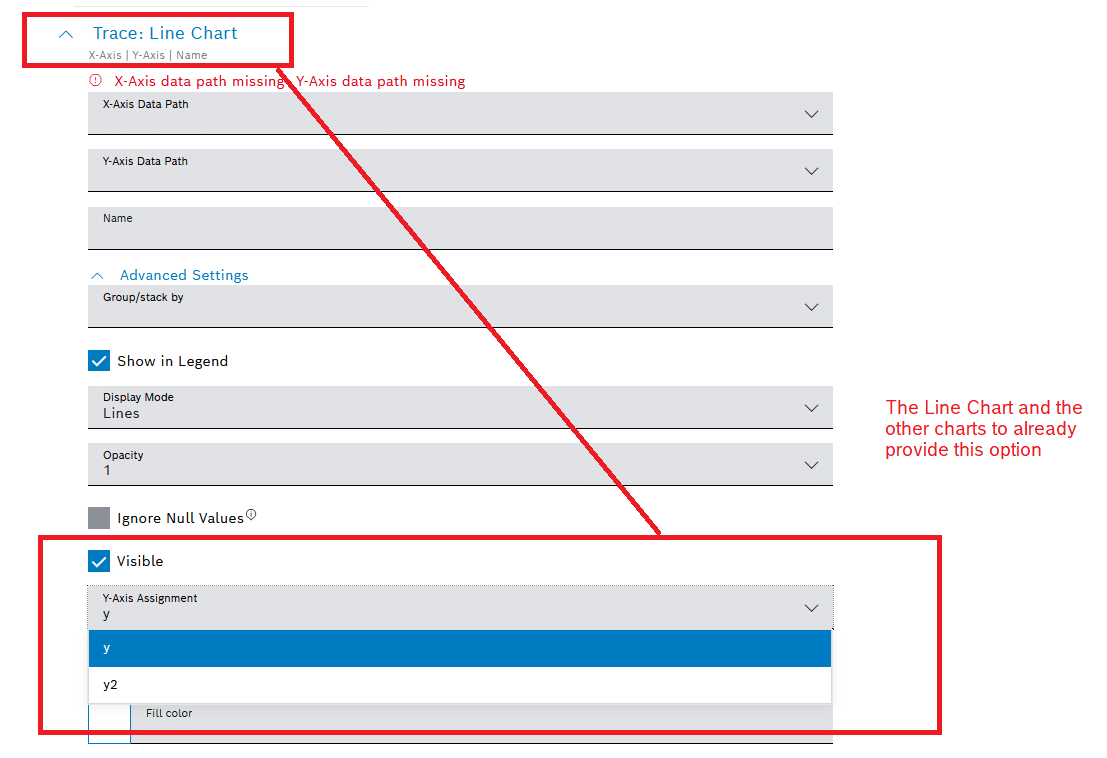
Second y-axis option for signal chart
An option to change the assigned Y axis is added under advanced settings.
You can change from the default Y axis to the Y2 axis where all values will be transferred and vice versa.
E.g., for Line Chart
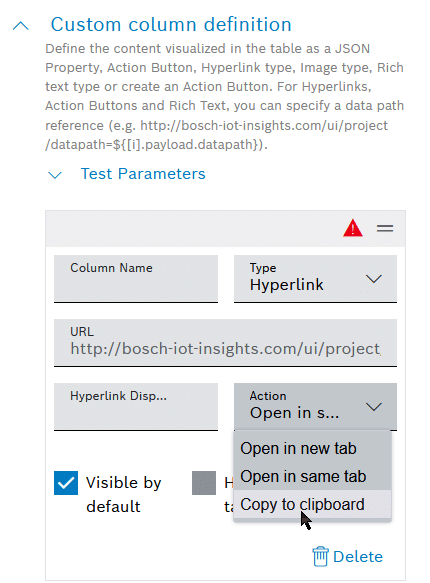
Action Button with new type to copy URL
The Link Button inside of the Action Button widget – as well as the hyperlink custom column definition type inside of the table widget – now support a new “Copy to clipboard” option, which allows the underlying link to be copied when clicked instead of navigating.
JMES Data Transformation
JMES Data Transformation enables the user to transform data on client side.
Especially when a widget has multiple data sources, or sources which are not based on a query template, this additional transformation stage allows you to adapt the retrieved data to your visualization needs.
This powerful tool extension provides new options to all users to optimize data for visualization.
See also the JMESPath documentation for a set of options.
SingleKey ID
Bosch ID will be migrated to SingleKey ID within 2023.
More details on SingleKey ID can be found at https://singlekey-id.com.
In preparation for the switch several changes have been made to support it and an announcement has been sent to each user.
As soon as it is available in early April you will see a screen like the following:
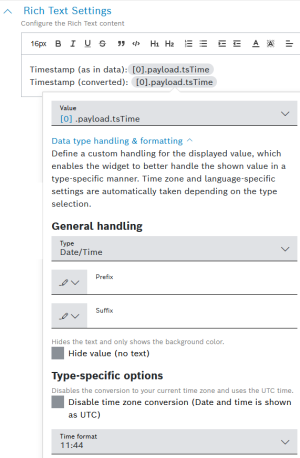
Rich Text widget with data type conversion
The rich text widget now supports data type conversion for reference values.
The data type conversion offers general transformation properties (like prefix, suffix, etc.), but also type specific options for String, Number and Date.
The following sample shows how to modify the output of a date field.
For more details see Rich Text.
–>
Tab widget with URL for bookmarking
You may already be aware that you can share and bookmark URLs of dashboards with filter parameter. Now you can also share and bookmark them if the dashboard contains a tab widget.
Technically, the URL will have a selectedTab number showing the index of the selected tab.
This guarantees that the dashboard will be opened within the same tab.
Further improvements
- Device Details Widget: images can be replaced directly from the device widget.
- Signal Chart: a “name” field is added to reference the signals visualized inside the chart; this is similar to other charts, e.g. Line Chart.
Bug fixes
In this release, we have addressed and fixed the following bugs:
- INS-4458 – Map Widget connected to “no data” Replay Widget should show “No data available”
- INS-4554 – Linking for processing information with multiples IDs does not work
- INS-4450 – Processing Information: Delete processed data does not work
- INS-4408 – Simple Search: Broken Input Validation and Chip-Update Mechanism
- INS-4468 – Data Browser: It shouldn’t be possible to add a search filter with an empty path
- INS-4462 – Map should be centered also when showing a legend
- INS-3680 – Device Details Widget: Issues in Notes Information Block edit mode
- INS-4592 – Widgets Data Sources: External Data Source cannot be removed
- INS-4907 – Map Widget: Defined Symbols should be shown in legend with all pins chosen
- INS-4909 – GPX map flickering
- INS-4892 – GPX Tracks are not shown anymore in Map Widget
- INS-4602 – Attributes feature in device management is not working properly
February
Februray 2, 2023: Bosch IoT Insights: SSL certificate update for the bosch-sfde.com domain
Our SSL certificate for the https://bosch-sfde.com domain will be renewed since the existing SSL certificate will expire on 11/02/2023.
If you hard-coded the current certificate, you will need to update your certificate chain after the renewal.
See our FAQs for further help: https://bosch-iot-insights.com/static-contents/docu/html/FAQ.html
We would also like to inform you that we are changing from the issuer QuoVadis Global SSL ICA G3 to let’s Encrypt.
Make sure you have the root certificates from the ISRG Root X 1.
Therefore, the frequency of further certificate exchange takes place every 60 to 90 days during the year without further announcement.
You can find information about the change of trust here: https://letsencrypt.org/certificates/
For now, the domain bosch-iot-insights.com is not affected by this change.
Though we are planning to establish the same procedure for this domain starting 31/08/2023.
January
January 30, 2023: Bosch IoT Insights: Optimization of Read Ticket Management
What are we optimizing?
Based on previous experiences and to further ensure the service’s stability and performance for all users, we are introducing an extension to our Read Ticket Management. We want to make sure that your subscription does not get overloaded with incoming query requests by single users, and that other users do not have to wait endlessly.
What is the current behavior?
If more query requests need to be executed than Read Tickets are available, the query request gets queued to wait for the next free Read Ticket. This can lead to the problem that one user can still occupy the whole queue by spoofing requests for a long period of time. This can block all other users and operations in the related project (subscription).
What is the change?
Each Read Ticket now comes with the possibility to queue 5 query requests. That means, if you have 3 Read Tickets booked, 15 query requests can be queued. We also added the new query status QUEUE_FULL which lets you know when there are too many query requests that have to be processed in parallel. Further query requests will not be added to the queue then. This way it is ensured that a single user cannot occupy the queue endlessly and other users still have access to the subscription data.
It ensures the stability of your database to prevent blocking states for your subscription.
Find more information on how to configure and monitor Read Tickets in the Bosch IoT Insights documentation. If you have any questions contact us via support or our Microsoft Team Channel.
